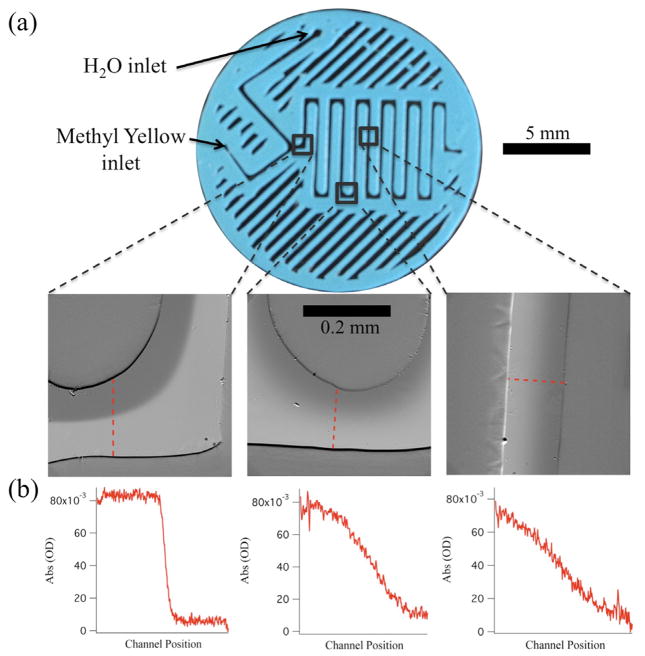
Figure 5.
Serpentine mixer with UV/visible absorbance detection. (a) Image of the mixer; the three outlined regions represent the positions along the flow corresponding to the absorbance images below the mixer. From left to right, the images represent times of 22 ms, 730 ms, and 1.04 s after the initial merge point. Absorbance was calculated as the negative logarithm of the ratio between sample image intensity with MY/ethanol flowing through the mixer and background image intensity with only ethanol flowing through the mixer. (b) Plots of the cross-sectional absorbance of the MY sample at the designated positions shown in the absorbance images above.

