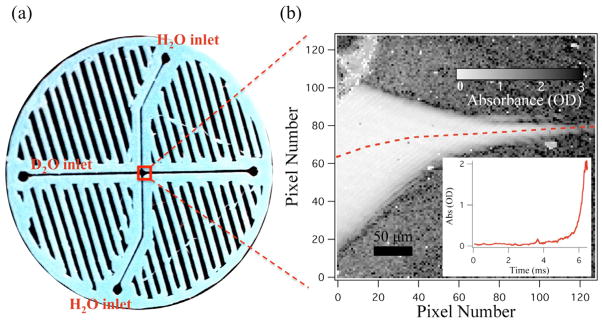
Figure 6.
Cross mixer with mid-infrared detection. (a) Image of the cross-mixer showing the D2O sample inlet and H2O side flow inlets. (b) Magnified mid-infrared absorbance image (grey scale of the mixing region) at 1643 cm−1. Absorbance is calculated as the negative logarithm of the ratio of sample and background images as described in the text. The H2O side flows squeeze the D2O into a jet, causing mixing, and an increase in the absorbance as shown in the inset. The pixel position to time conversion was done through COMSOL simulations. D2O had a sample flow of 3 μL min−1 and the H2O sheath had a flow of 50 μL min−1 for each side in the cross-mixer.

