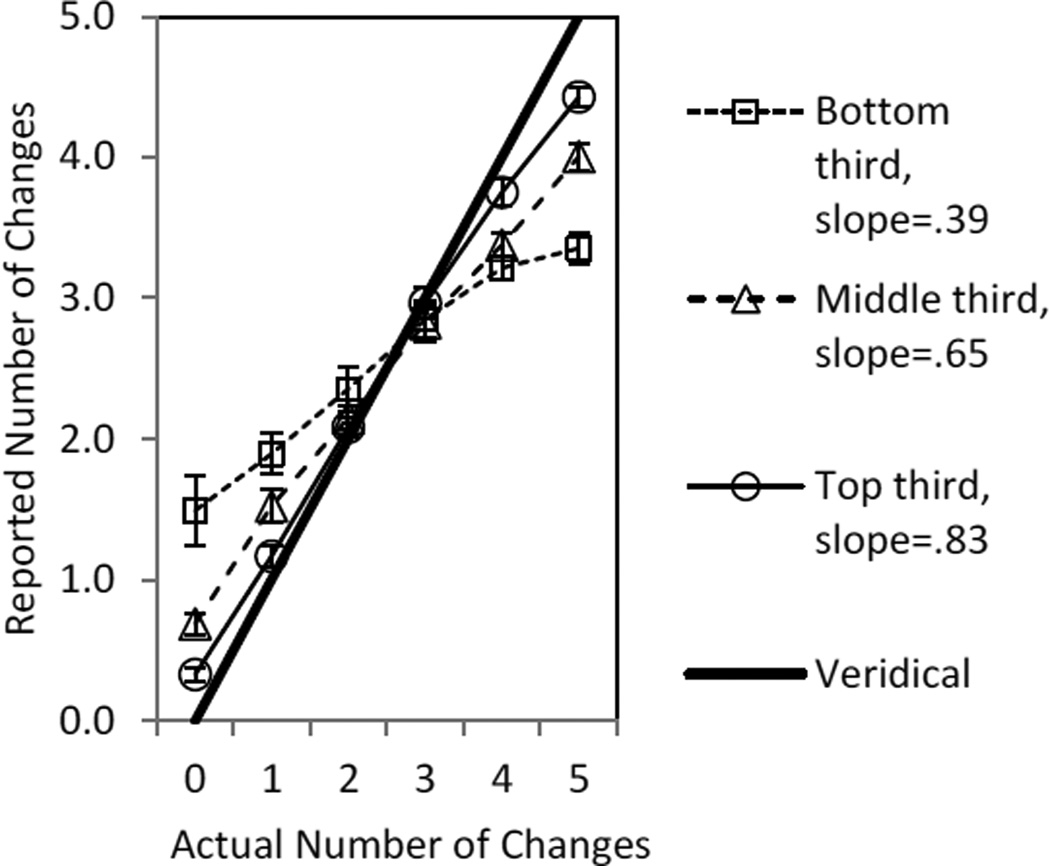
Figure 2.
For performance thirds of the sample in Experiment 1, the mean reported number of changes in the array for each number of actual changes in the array. The functions approximate straight lines and the reported slopes are the average individual slopes for these performance thirds. Error bars are standard errors. Veridical performance (thick line) would yield a slope of 1.0.

