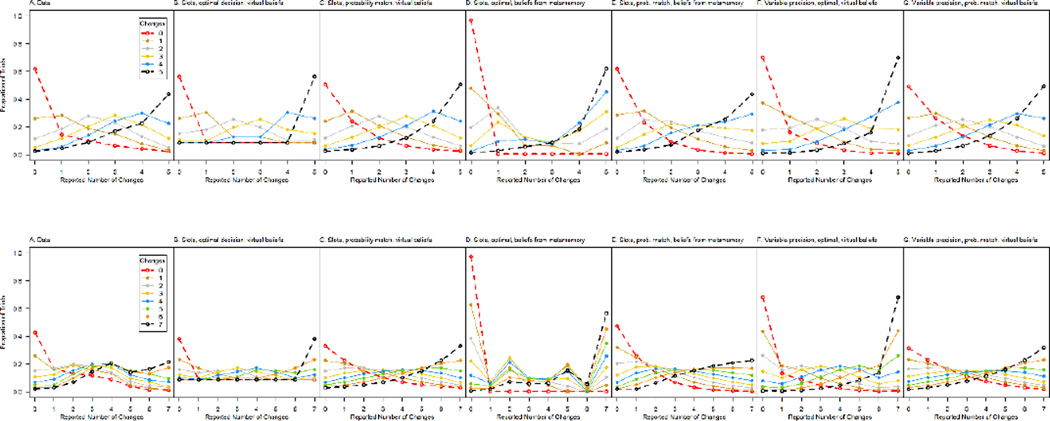
Figure 5.
Pattern of responding in Experiment 1 (top left figure) and Experiment 2 (bottom left figure) along with the predictions of a number of viable or nearly-viable models. Each panel shows the proportion of responses with each reported number of changes (x axis) for each actual number of changes (graph parameter). The models differ in whether they are based on limited slots (B–E) or precision (F–G), whether the decision basis is optimal (B, D, F) or according to probability matching (C, E, G), and whether the belief about the number or precision of items in working memory is virtual (B, C, F, G) or based on the metamnemonic judgments (D, E). We did not develop precision models with an alternative belief so the results do not rule out precision models. For the data, the maximum standard error of the mean for any one data point shown is 0.02 in Experiment 1 (top left panel) and 0.03 in Experiment 2 (bottom left panel).

