Figure 5.
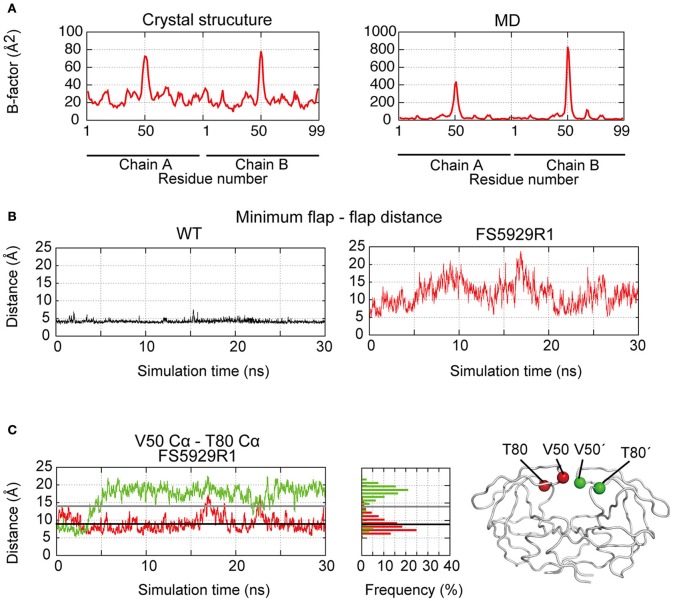
Flap dynamics in the crystal structure and MD simulations. (A) B factors of the respective residues in the FS5929R1 PR estimated from the crystal structure and MD simulations. (B) The minimum distance between two flaps in the WT and FS5929R1 PRs calculated with an in-house program. (C) The time course of the distance between the V50 Cα and the T80 Cα (left, red) or between the V50′ Cα and the T80′ Cα (left, green) and their histogram (center). The black and gray solid lines indicate the distances in the crystal structure from our study and an open-form structure (PDB ID: 3UF3), respectively. The structural positions of the V50 and T80 Cαs (red) in one monomer and the V50′ and T80′ Cαs in a second monomer are highlighted on the right side of the figure of the PR structure.

