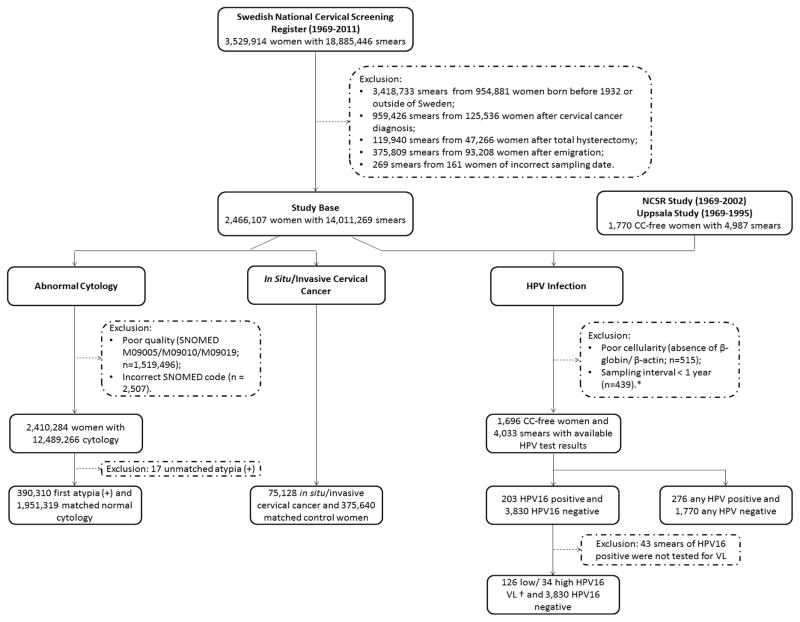
Figure 1. A Flow Chart Describing the Study Base and Three Analyses on Abnormal Cytology, Cervical Cancer and HPV Infection.
Note: CC, cervical cancer; HPV, Human papillomavirus; NCSR, National Cervical Screening Register; VL, viral load; SNOMED, the diagnostic codes used by Swedish Association for Clinical Cytology.
* Among consecutive smears with a sampling interval of less than one year, only the first smear was included, assuming that the following smears within the one-year time window were more likely diagnostic smears and not independent from the first smear.
† We classified 160 HPV16 positive smears as high or low viral load infection based on the median viral load values. Due to a batch effect observed in the NCSR Study, cut-off values were calculated both per sampling period (1969–1984/1985–1989/1990–1994/1995–2005) and per test period (2005–2007/2008–2009).

