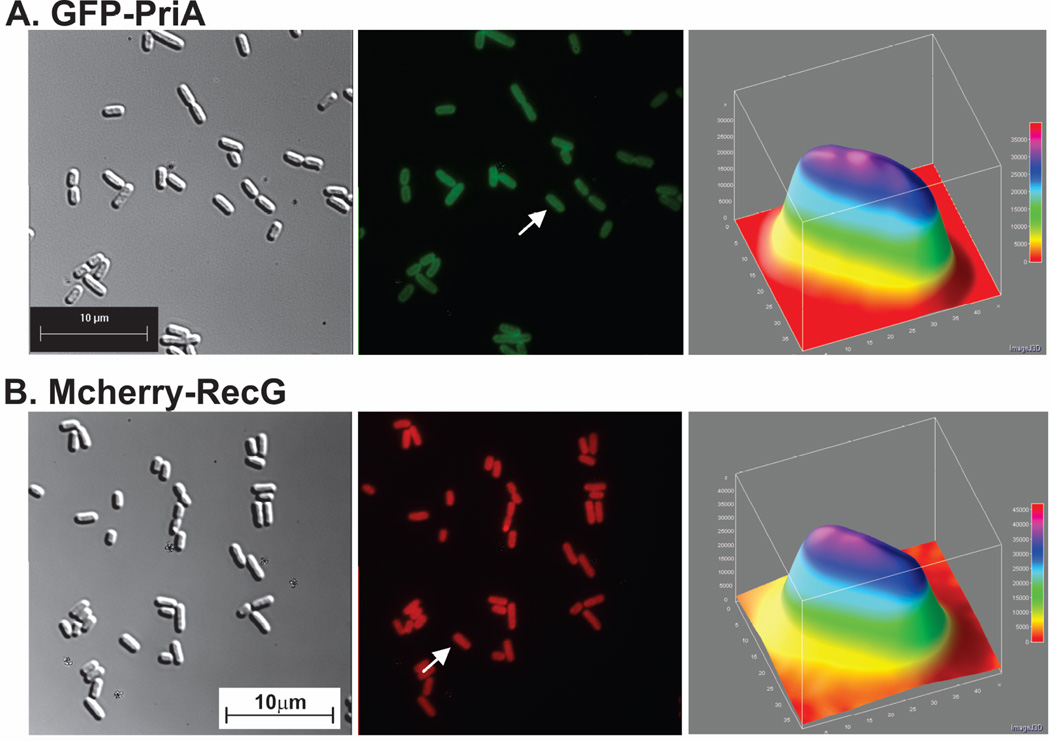
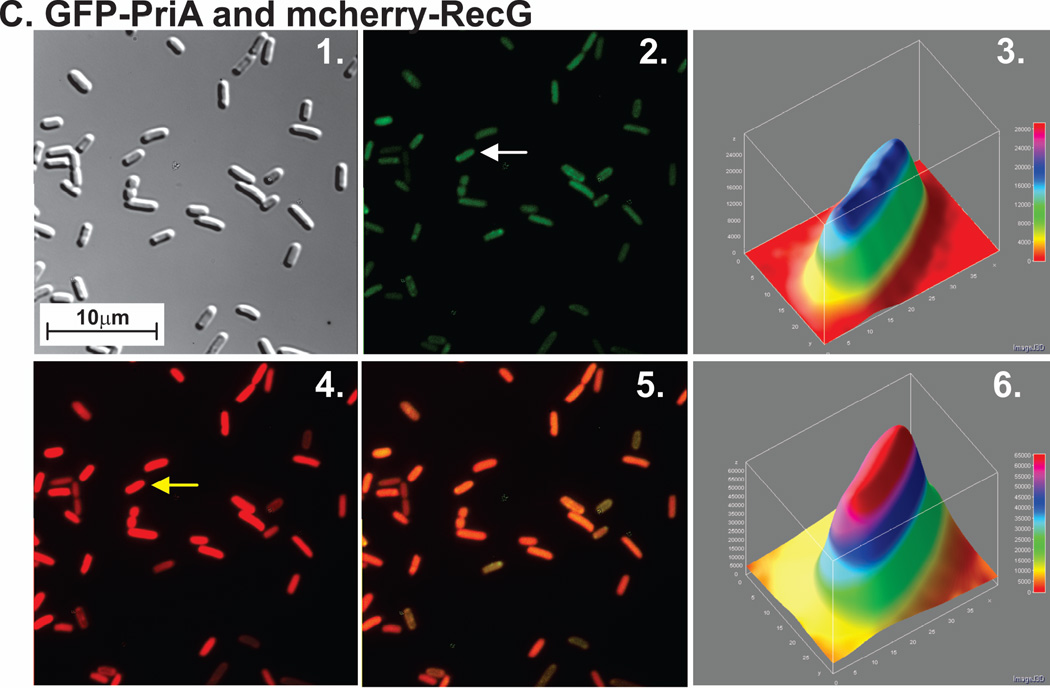
Figure 1. PriA and RecG are distributed throughout the cell in the presence of endogenous levels of SSB.
For each strain, proteins were expressed from low copy number vectors. Here, overnight cultures from a single colony from which expression had been verified, were diluted 1:100 into 5ml of fresh LB containing antibiotics and grown for 4 hours in the absence of IPTG. Cells were harvested by centrifugation, resuspended into 10 mM MgSO4, attached to poly-L-lysine coated coverslips and imaged as described in Experimental Procedures. Representative microscopy images are presented showing the distribution of PriA and RecG in the presence of chromosomal SSB. The magnification in each microscope image is 400x. (A), GFP-PriA; (B), mcherry-RecG and (C), GFP-PriA and mcherry RecG co-expressed. In Figure 1A and B, panel 1 is the differential interference contrast (DIC) image; panel 2 is the image captured using the corresponding fluorescence filter for each protein; and panel 3 is a 3-D surface plot of a single cell in the center panel indicated by the arrow. (C), GFP-PriA and mcherry-RecG were co-expressed in the same cell. In Figure 1C, panel 1 corresponds to the DIC image; panel 2, fluorescence image captured with the GFP filter (PriA); panel 3, a 3-D surface plot of a single cell in panel 2 indicated by the arrow; 4, fluorescence image captured with the mcherry filter (RecG); 5, colocalization image of panels 2 and 4; panel 6, a 3-D surface plot of a single cell in panel 4 indicated by the arrow. The 3-D surface plots were done using ImageJ.


