
Figure 3. Efficient localization of PriA and RecG to the cell periphery requires the SSB C-terminus and the presence of both DNA helicases.

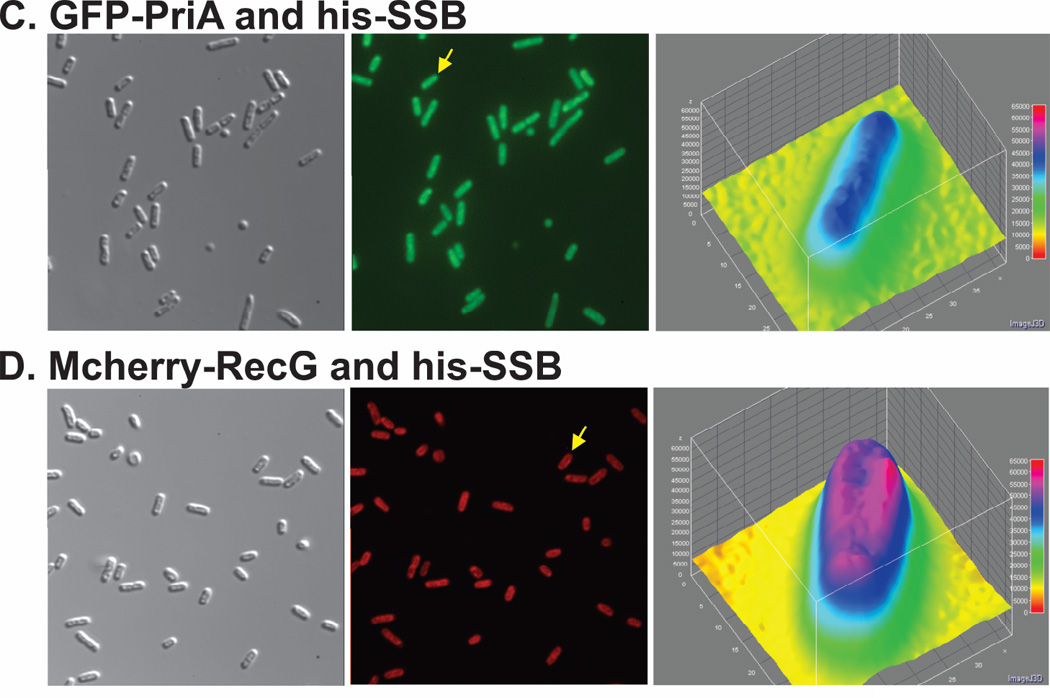
Fluorescence microscopy images and analysis of cells where fluorescent tagged helicases and SSBΔC8 were co-expressed. Mutant SSB was expressed from pET28 while the helicases were expressed from low copy number vectors. To determine localization, overnight cultures from a single colony from which expression had been verified using SDS-PAGE and bulk-phase fluorescence measurements, were diluted 1:100 into 5mL of fresh LB containing antibiotics and grown for 4 hours in the absence of IPTG. Cells were harvested by centrifugation, resuspended into 10 mM MgSO4, attached to poly-L-lysine coated coverslips and imaged as described in Experimental Procedures. Representative microscopy images are presented. The magnification in each microscope image is 400x. (A), GFP-PriA and SSBΔC8. Panel 1, DIC image; 2, GFP; 3, a 3-D surface plot of a single cell in panel 2 indicated by the yellow arrow. (B), mcherry-RecG and SSBΔC8. Panel 1, DIC image; 2, mcherry; 3, a 3-D surface plot of a single cell in panel 2 indicated by the yellow arrow. White arrows indicate cells where localization to the cell periphery can be discerned. (C), Representative images of cells expressing SSB and GFP-PriA. Panel 1, DIC image; 2, GFP; 3, a 3-D surface plot of a single cell in panel 2 indicated by the yellow arrow. (D), Representative images of cells expressing SSB and mcherry-RecG. Panel 1, DIC image; 2, mcherry; 3, a 3-D surface plot of a single cell in panel 2 indicated by the yellow arrow. The 3-D surface plots were generated using ImageJ.