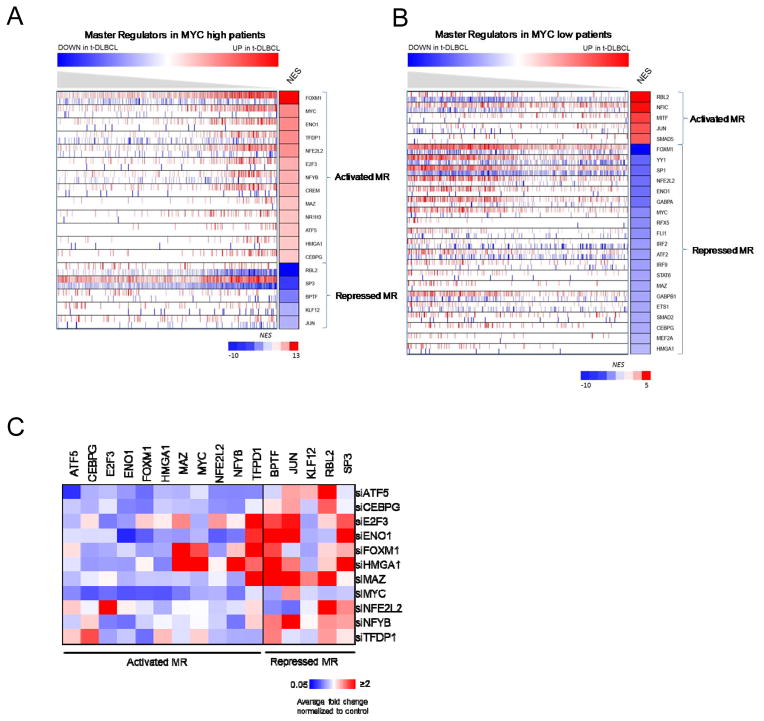
Figure 2. MR inference and mRNA expression after silencing of activated MRs in SUDHL6 cell line.
(A) MR of high MYC activity patients; (B) MR of low MYC activity patients. Genes are sorted by NES; red, activated-MR; blue, repressed-MR. (C) qRT-PCR analysis of MR mRNA levels at 20h after siRNA silencing in SUDHL6. Relative mRNA expression levels of activated-MR and repressed-MR were normalized to GAPDH. Heatmap represents average fold change normalized to control non-target siRNA. Blue, downregulation; white, no change; red, upregulation (Supplementary Table S2).

