Figure 5.
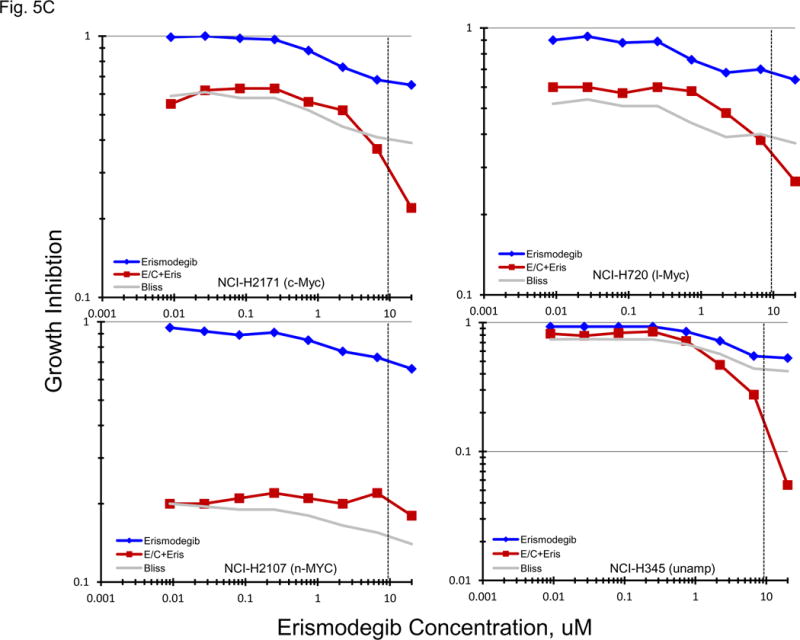
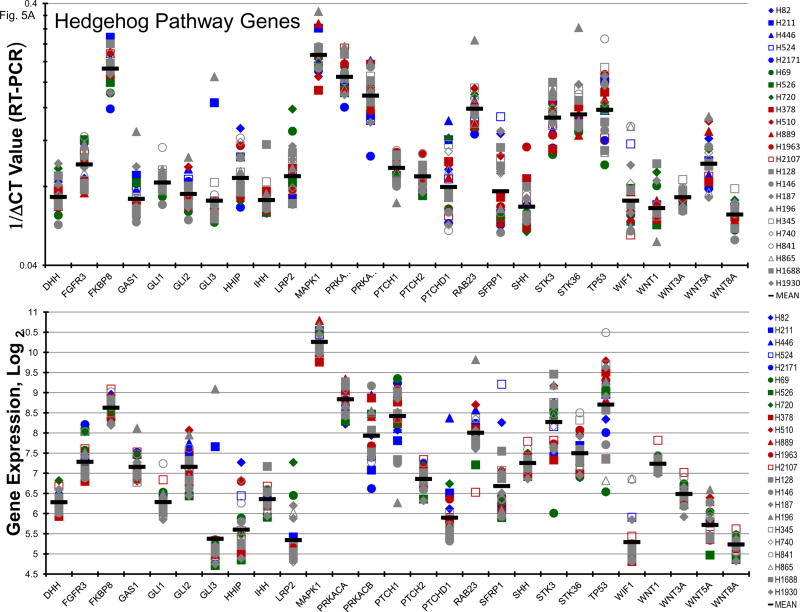
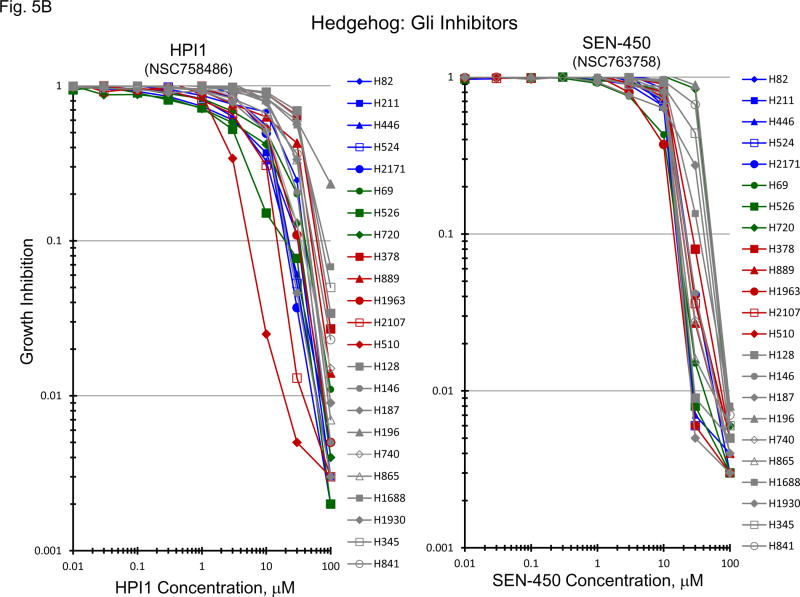
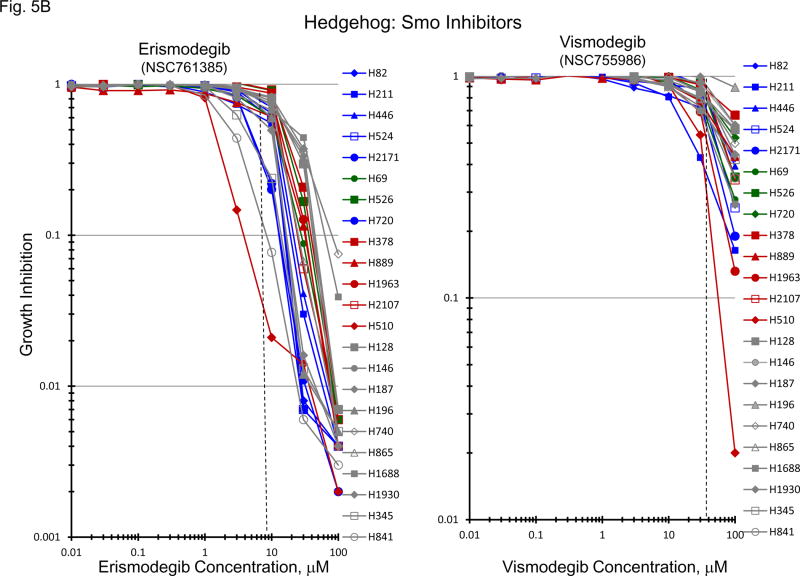
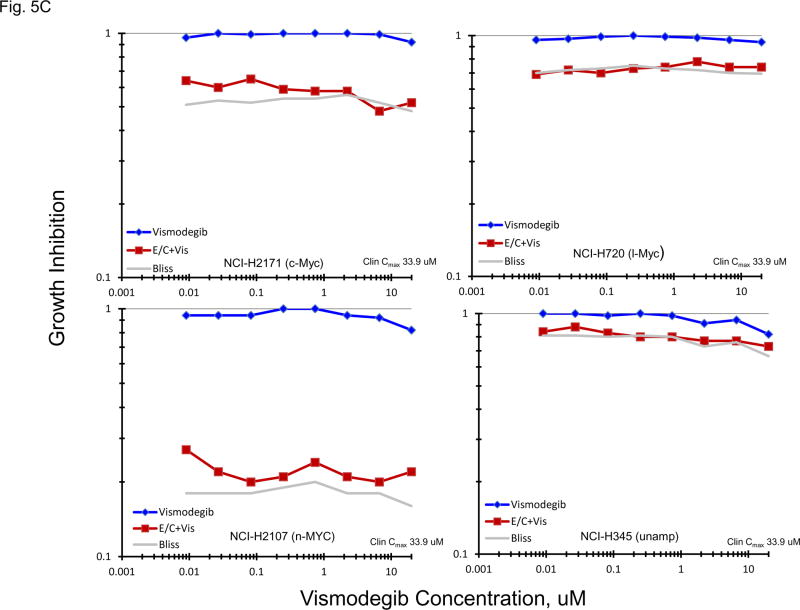
PANEL A Expression of genes associated with the Hedgehog pathway in 23 SCLC lines as determined by the 1/ΔCT value from RT-PCR or as log2 from gene expression derived from exon arrays. The blue symbols represent c-MYC amplified SCLC lines (n = 5), green symbols represent n-MYC amplified SCLC lines (n = 3), red symbols represent l-MYC amplified SCLC lines (n = 5) and gray symbols represents MYC unamplified SCLC lines (n = 10). PANEL B: Concentration response curves for the 23 SCLC lines exposed to 0.01 – 100 uM of the Gli inhibitors, HPI1 and SEN-450, and the Smo inhibitors, erismodegib and vismodegib, for 96 h. The blue symbols represent c-MYC amplified SCLC lines (n = 5), green symbols represent n-MYC amplified SCLC lines (n = 3), red symbols represent l-MYC amplified SCLC lines (n = 5) and gray symbols represents MYC unamplified SCLC lines (n = 10). The dotted lines are the clinical Cmax for erismodegib and vismodegib. The experiments were repeated 3–4 times. PANEL C: Concentration response curves for 4 representative SCLC lines exposed to 0.01 – 20 uM of erismodegib or vismodegib alone (blue line) or in simultaneous combination with 3.7uM carboplatin and 0.3uM etoposide (red line). The gray line is calculated simple Bliss additivity for the combination regimen.

