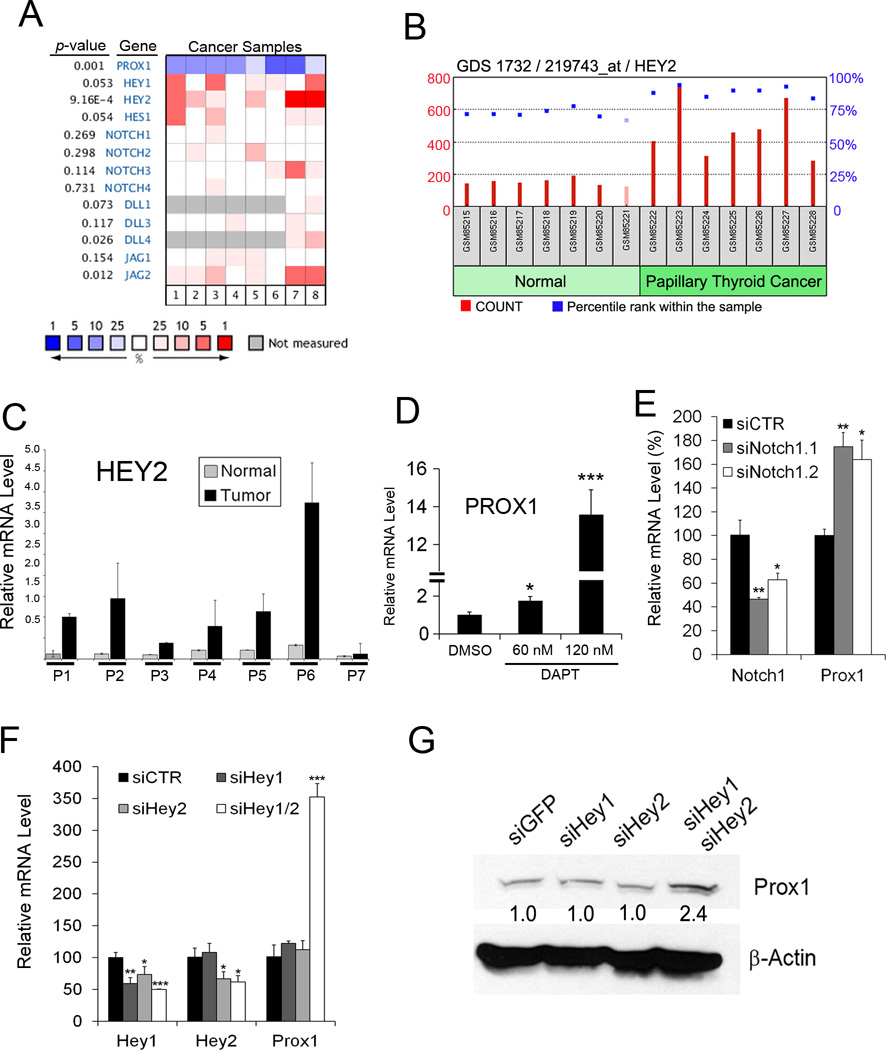
Figure 2. NOTCH is responsible for PROX1 downregulation in thyroid cancers.
(A) Heat map showing expression of NOTCH genes in the following thyroid cancers, compared to normal thyroid tissues. Lane 1, follicular variant PTC (11); Lane 2, tall cell variant PTC (11); Lane 3, follicular carcinoma (11); Lane 4, oncocytic follicular carcinoma (11); Lane 5, PTC (11); Lane 6, undifferentiated (anaplastic) carcinoma (11); Lane 7, PTC (18); Lane 8, PTC (12). Heat map represents the median percentile rank for a given gene across each of the analyses. Data source: GSE27155 (11) (B) HEY2 mRNA levels were determined in seven PTC vs. their paired normal tissues, and displayed for relative probe intensities (count) and percentile ranks (%) within the sample. Data source: GSE3678. (C) qRT-PCR assays showing HEY2 mRNA levels in the normal vs. tumor samples of panel (B). (D,E) NOTCH Inhibition in BCPAP cells using DAPT (60 and 120 nM) (D) or two different siRNAs against NOTCH1 (E) for 48 hours resulted in PROX1 upregulation in BCPAP. (F,G) HEY1 and HEY2 synergistically downregulate PROX1. Expressions of HEY1 and/or HEY2 were inhibited by their corresponding siRNA in BCPAP cells (F) and TPC1 cells (G). After 48 hours, PROX1 expression was determined by qRT-PCR (F) or western blot (G) analyses. Error bars present standard deviations. *, p < 0.05; **, p < 0.01; ***, p < 0.001.

