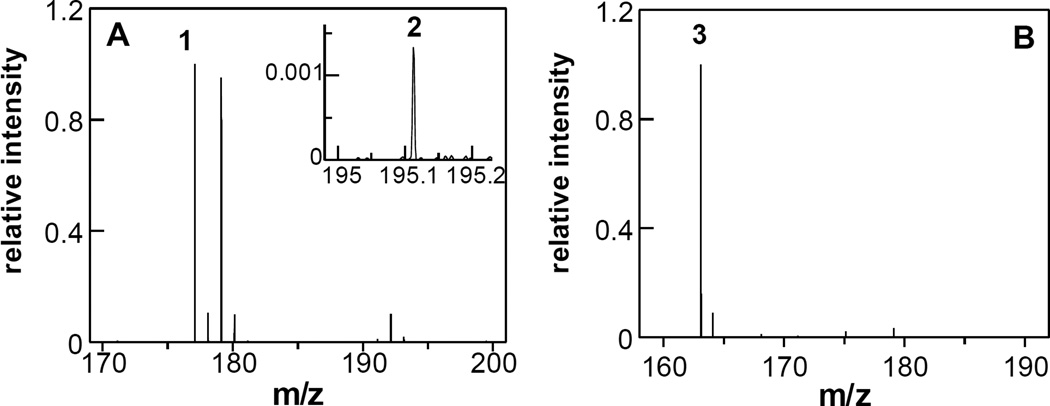
Figure 2.
Identification of the LHNO product by continuous flow mass spectrometry. A: Mass spectrum of the reaction of 35 µM LHNO with 35 µM (R,S)-6-hydroxynicotine at a reaction time of 1.2 s at 25 °C. Ion signals are normalized to the most intense ion (1). Inset: A close-up of the mass spectrum showing the second reaction product (2). B: Mass spectrum of the reaction of 35 µM LHNO with 35 µM (S)-6-hydroxynornicotine at a reaction time of 0.5 s at 25 °C. Ion signals are normalized to the most intense ion (3).The spectra are averages of 200 scans.

