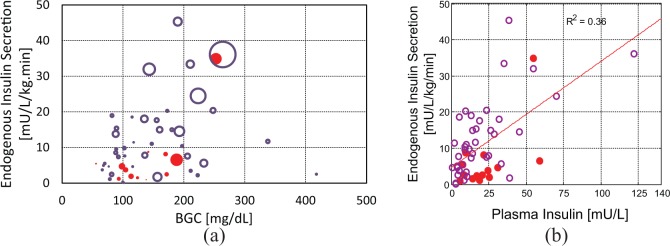
Figure 3.
Endogenous insulin secretion with (a) blood glucose concentration (BGC) and plasma insulin concentration, and (b) plasma insulin. In (a) data points are scaled in size by the magnitude of plasma insulin, with larger data points representing samples with higher plasma insulin concentration. Open (o) and closed (●) circles denote results from infants not receiving and receiving exogenous insulin at the time of sampling, respectively.

