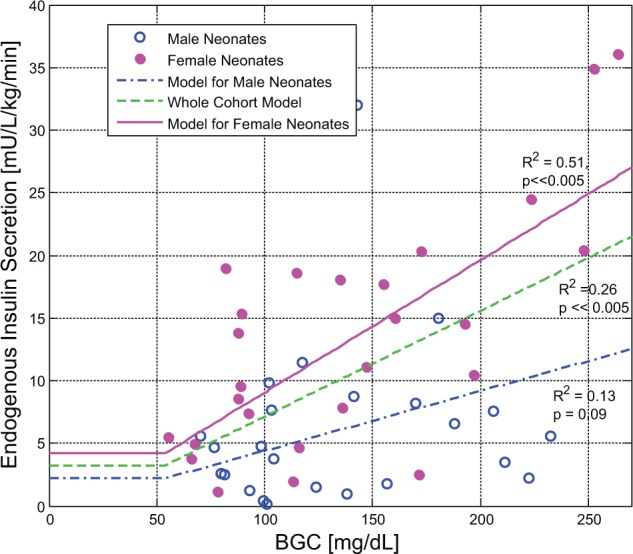
Figure 4.

Models of endogenous insulin secretion as a function of blood glucose concentration (BGC) over the whole cohort and male and female subcohorts. A total of 5 data points from 54 total (9%) were excluded from the analysis as outliers based on a 2- to 3-fold difference with other data points of similar BGC. Of these data points, 3/5 were from heavier and older patients of GA > 29 weeks. However, 2 were from male and female babies with a GA of 26 weeks.
