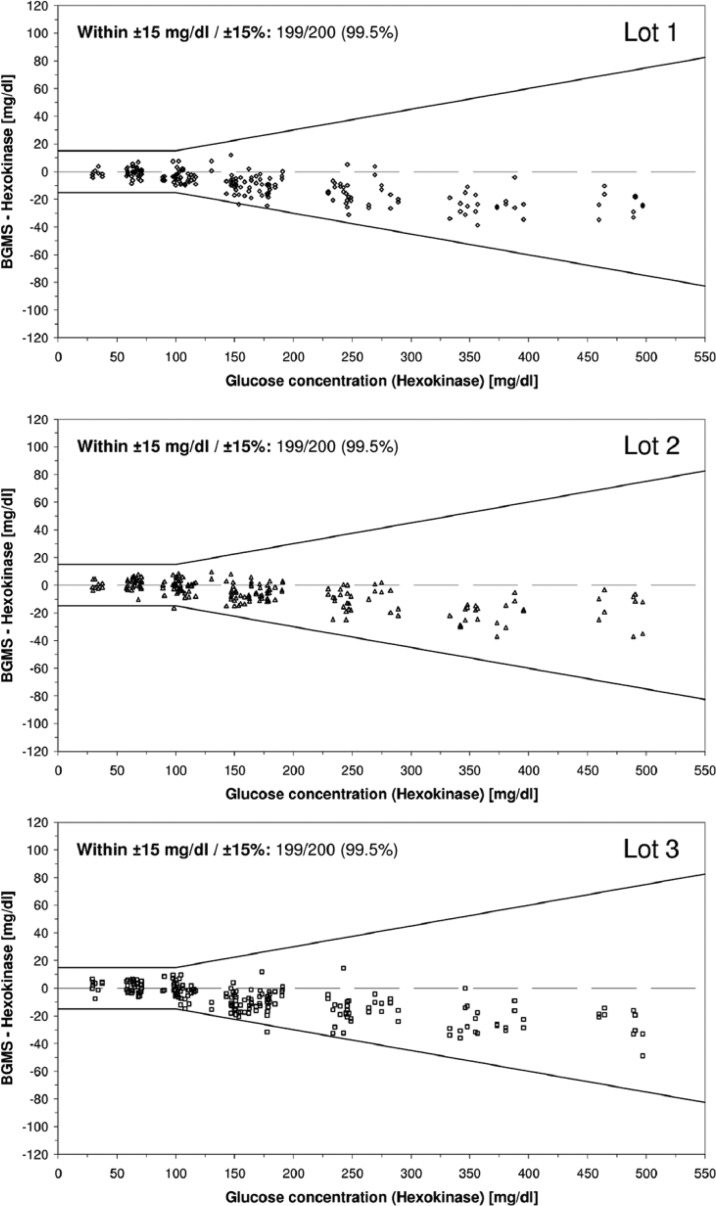
Figure 1.
System accuracy for each individual lot: Absolute differences between BGMS results and comparison measurement results. For each lot, 200 data points are shown (100 samples measured in duplicate). Lines indicate limits of ISO 15197:2013, number and percentage of the results within these limits are given in the upper left corner (mg/dL limits for glucose concentrations <100 mg/dL, % limits for glucose concentrations ≥100 mg/dL).

