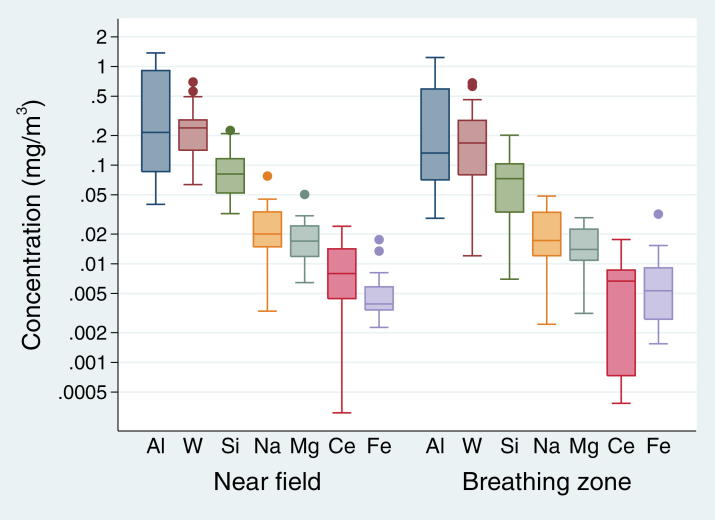
Figure 3.
Boxplot of the elemental composition of particles at the NF and BZ, showing the interquartile range (IQR) as the length of the box, the median (line dividing the box), the whiskers spanning all data points within 1.5 IQR of the nearer quartile, and outliers (filled-in circles). Results are presented in mg per unit air. There was no statistically significant difference in elemental concentrations between the two sampling locations.

