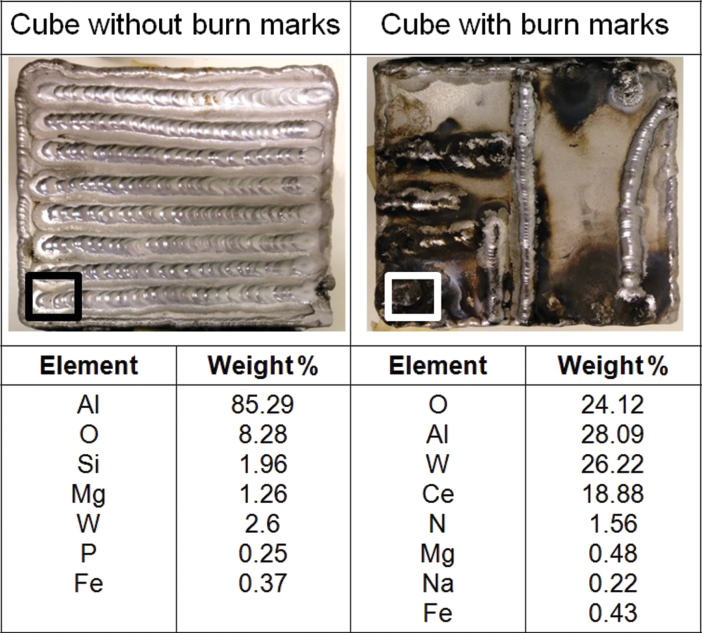
Figure 4.
Comparison of two completed TIG welding tasks of two different volunteers, showing differences in TIG welding performance in regards to the quality of the weld. The square on the bottom left corner of each cube indicates the area where EDS analysis of the surface composition was performed. Elemental concentrations are expressed as percentages of overall weight.

