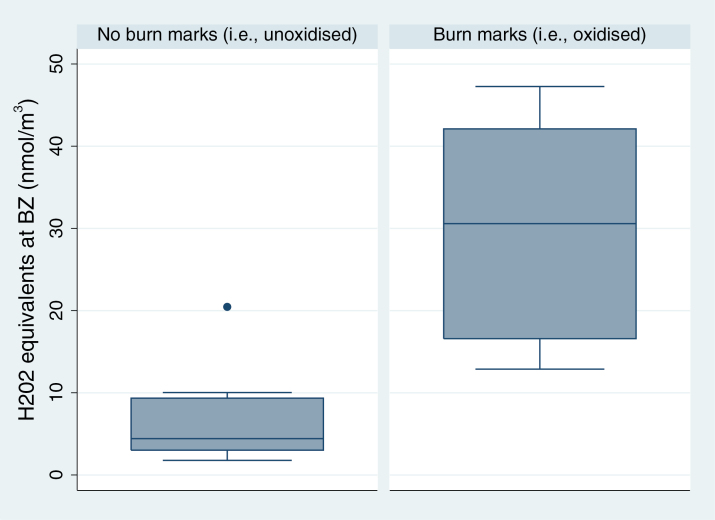
Figure 5.
Boxplot showing IQR (box), median (line dividing box), whiskers spanning all data points within 1.5 IQR of the nearer quartile, and outlier (filled-in circles) of reactive oxygen species (ROS) production potential values (shown as H2O2 equivalents per filter in nmol) at the breathing zone (BZ) of two groups of volunteers: those that completed their task without any evidence of burn marks (metal not oxidized) and those that completed their task with evidence of burn marks (metal oxidized).

