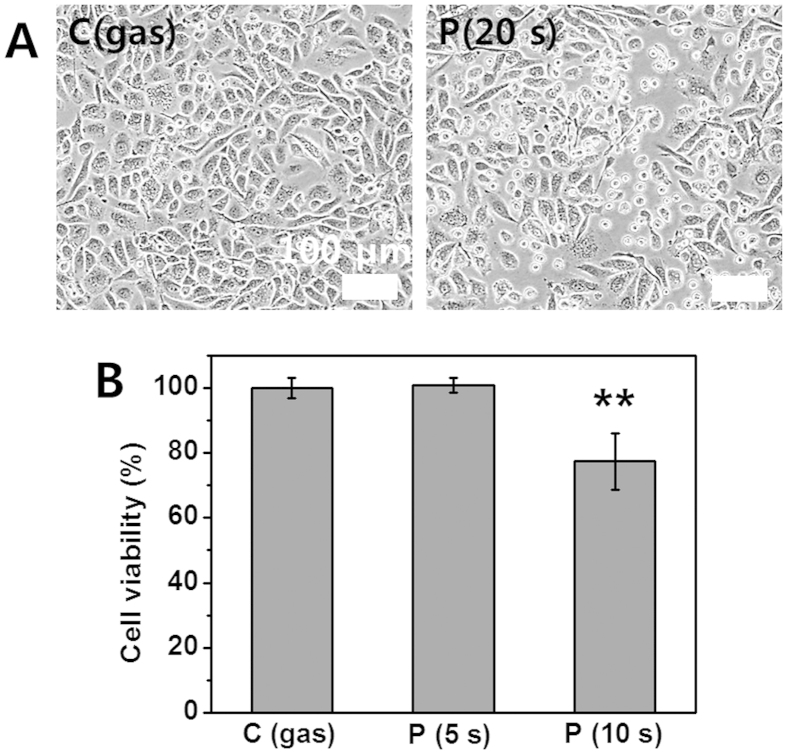
Figure 2. Morphological change and reduction in viability of PC3 cancer cells (using Jet-Type 1).
(A) Bright field images of cells (left: gas-treated control; right: detachment from surface after plasma treatment (0.8 kVrms) for 20 s). (B) Measurement of cell viability by MTS assay at 24 h after gas (10 s) and plasma treatment (0.8 kVrms) for 5 and 10 s on five points (Each point represents mean ± SD of three replicates; **p < 0.01). Scale bar = 100 μm.

