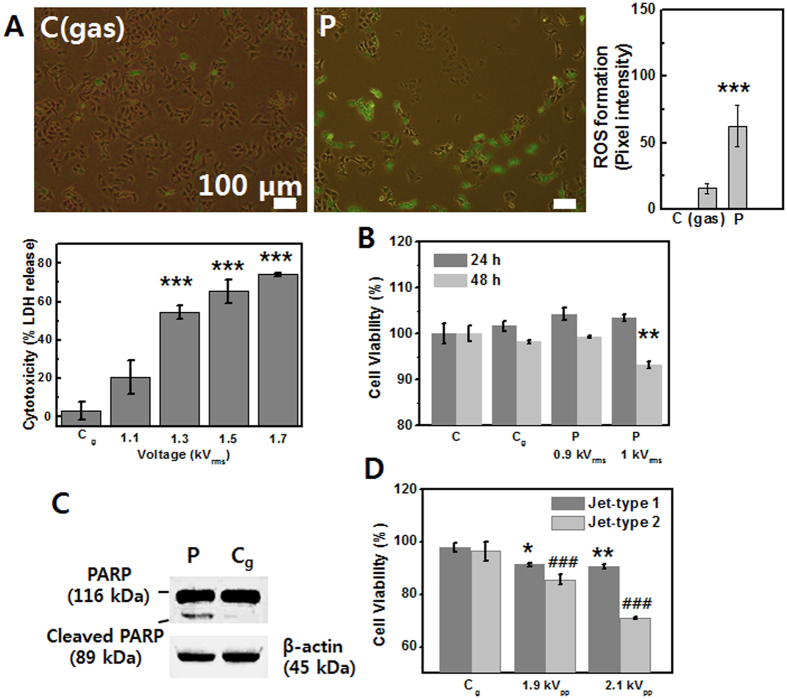
Figure 5. Induction of necrotic and apoptotic cell death in A549 cancer cells (using Jet-Type 1).
(A) Merged image of fluorescence using DCF-DA with bright field images and intensity graphs after plasma treatment (1.2 kVrms) for 10 s (upper row, left: gas-treated control, right: plasma-treatment) and cytotoxicity (% LDH) rate as a function of applied voltage (bottom row). Scale bar = 100 μm. (B) Measurement of cell viability by MTS assay at 24 and 48 h after gas and plasma treatment (0.9 and 1 kVrms) for 10 s on five points. (C) Immunoblot of PARP at 24 h after gas and plasma treatment (1 kVrms) for 10 s on nine points per 35-mm dish. Blot was probed with anti-actin to ensure equal protein loading. (D) The rate of cell viability by using Jet-Type 1 and 2 under the same parameter with a pulsed high-voltage supply as a function of applied voltage. (Each point represents mean ± SD of three replicates; *p < 0.05, **p < 0.01, ***p < 0.001).

