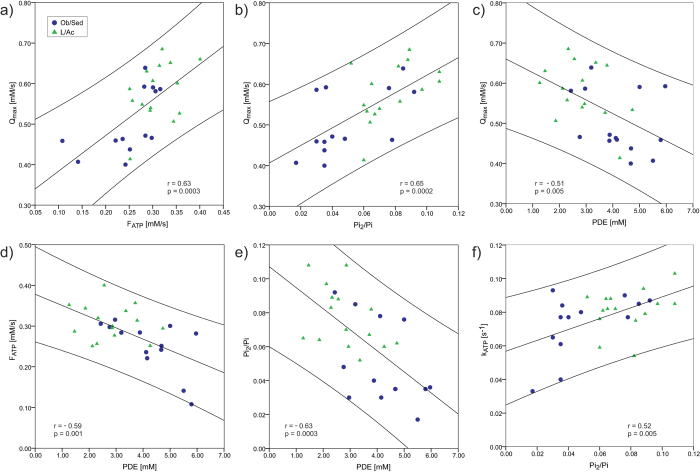
Figure 3.
Plots of correlations between myocellular energy metabolism parameters measured by dynamic and static 31P-MRS in Ob/Sed ( ) andL/Ac (
 ) individuals: (a) mitochondrial capacity (Qmax) with the Pi-to-ATP forward metabolic flux at rest (FATP); (b) Qmax with the ratio of alkaline Pi to main Pi (Pi2/Pi); and (c) Qmax with the concentration of phosphodiesters ([PDE]). Further correlations of the 31P-MRS parameters measured at rest: (d) FATP with [PDE]; (e) Pi2/Pi with [PDE]; and (f) Pi-to-ATP exchange rate constant (kATP) with Pi2/Pi. 95% confidence intervals are also depicted.

