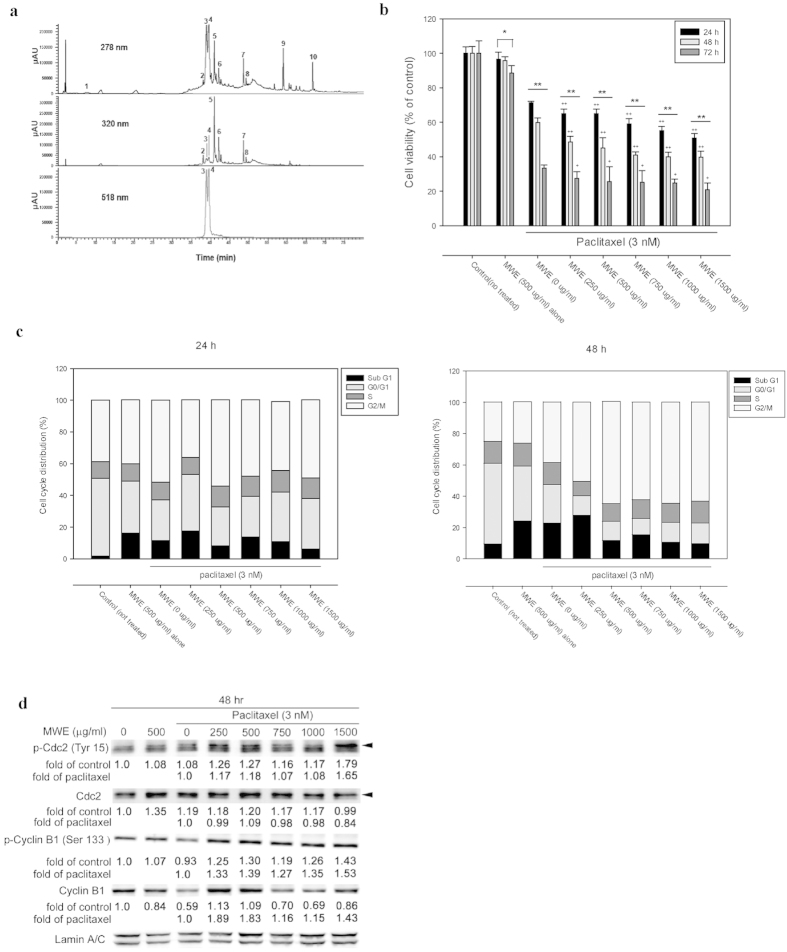
Figure 1. Paclitaxel combined with MWE induced TSGH 8301 bladder carcinoma cell death by arresting the cell cycle at the mitotic phase.
(a) HPLC-DAD profiles of MWE. A gradient solvent elution system was used over 80 min with acetonitrile (containing 0.1% formic acid) and 0.1% aqueous formic acid at a flow rate of 0.2 ml/min. Detection is shown at 278, 320 and 518 nm. The numbering of the peaks refers to their identification, as shown in Table 1. (b) TSGH 8301 cells were treated with paclitaxel alone or combined with the indicated concentrations of MWE for 24, 48 and 72 hr before being subjected to the MTT assay for cell viability. The data are expressed as a percentage of control (not treated) and presented as the means ± SD. One-way ANOVA with post-hoc Dunnett’s test was used to calculate the p value for each dose treatment compared to paclitaxel alone, (+p < 0.05; ++p < 0.01) and between time points (*p < 0.05; **p < 0.01). (c) TSGH 8301 cells were treated with paclitaxel (3 nM) and MWE (0–1500 μg/ml) and then subjected to cell cycle distribution analysis by flow cytometry at 24 hr and 48 hr. (d) Protein samples were prepared from different treatments at 48 hr and analyzed by Western blotting for Cdc2 and Cyclin B1. The numbers under each blot are the intensity of each band relative to that of the control (not treated) or paclitaxel alone. The blots were reprobed with an anti-Lamin A/C antibody to confirm equal loading of the samples. Arrow head indicated the band used for quantitation. The results shown are representative of three independent experiments with similar results.

