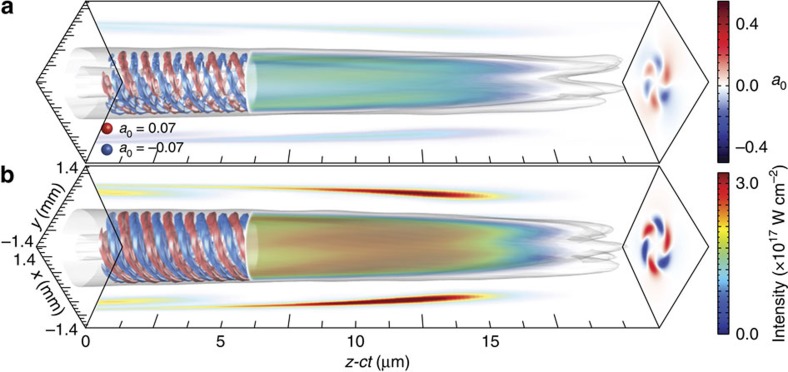
Figure 3. Simulation results showing the generation and amplification of a new OAM modes.
The new mode with  grow from a seed with
  and a linearly polarized pump with a Gaussian profile in the x direction, and with an OAM
  in the y direction. z=2 mm (a) and z=6.22 mm (b). The initial set-up is illustrated in Fig. 1b. Projections in the (x,z-ct) and (y,z-ct) planes show intensity profile slices at the mid-plane of the OAM mode (blue–green–red colours). Projections in the (x,y) plane (blue–white–red) show the normalized vector potential (a0) field envelope of the new OAM mode at the longitudinal slice where the laser intensity is maximum. The envelope of the 3D laser intensity is also shown for z>6.25 mm in blue–green–red colours, and normalized vector potential isosurfaces for z<6.25 mm in blue and red.

