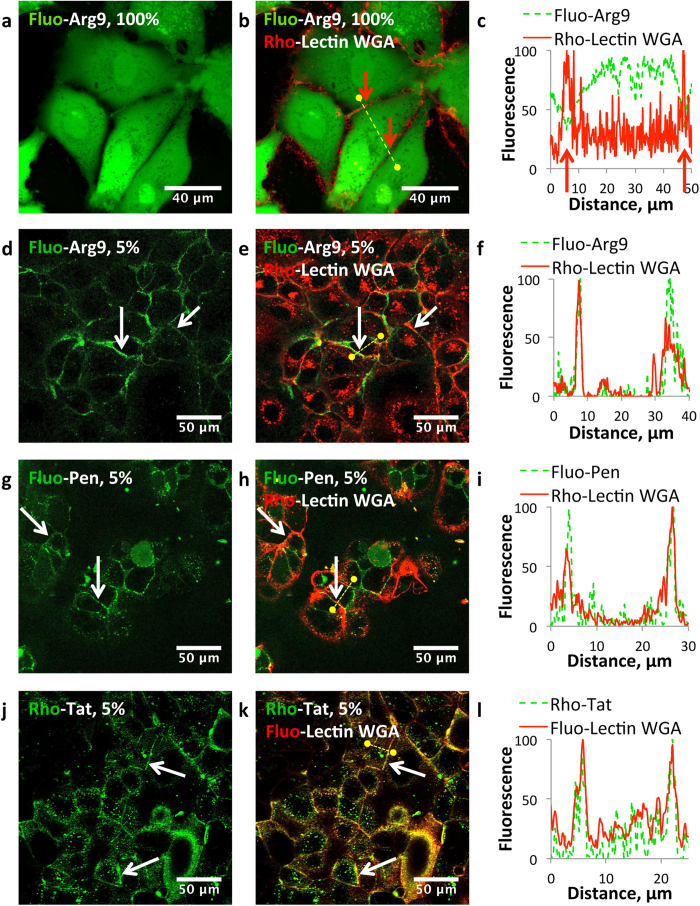
Figure 2. “Dilution” of the fluorescent CPP by its acetylated analogue reveals plasma membrane bound CPP.
Unfixed MA-104 or Caco-2 cells were visualized by CLSM after 10 min incubation with 20 μM CPP (in green) and a fluorescent Lectin WGA (0.02 mg.mL−1, red) in Opti-MEM. Cells were washed with Opti-MEM prior to observation. (a–c) MA-104 cells incubated with 20 μM Fluo-Arg9 and Rho-Lectin WGA. (d–f) MA-104 cells incubated with Fluo-Arg9 (5%, 1 μM) in the presence of a large excess of its acetylated analogue (95%, 19 μM) and Rho-Lectin WGA. (g–i) Caco-2 cells incubated with Fluo-Pen (5%, 1 μM) in the presence of a large excess of its acetylated analogue (95%, 19 μM) and Rho-Lectin WGA. (j–l) Caco-2 cells incubated with Rho-Tat (5%, 1 μM) in the presence of a large excess of its acetylated analogue (95%, 19 μM) and Fluo-Lectin WGA. Pictures (a,d,g,j) feature only the fluorescence of the peptide, whereas pictures (b,e,h,k) are overlays of the fluorescence of the CPP and of the Lectin WGA. (c,f,i,l) show the intensity profiles of the fluorescence from the CPP and from the Lectin WGA along the yellow dotted line on the picture in the same row.

