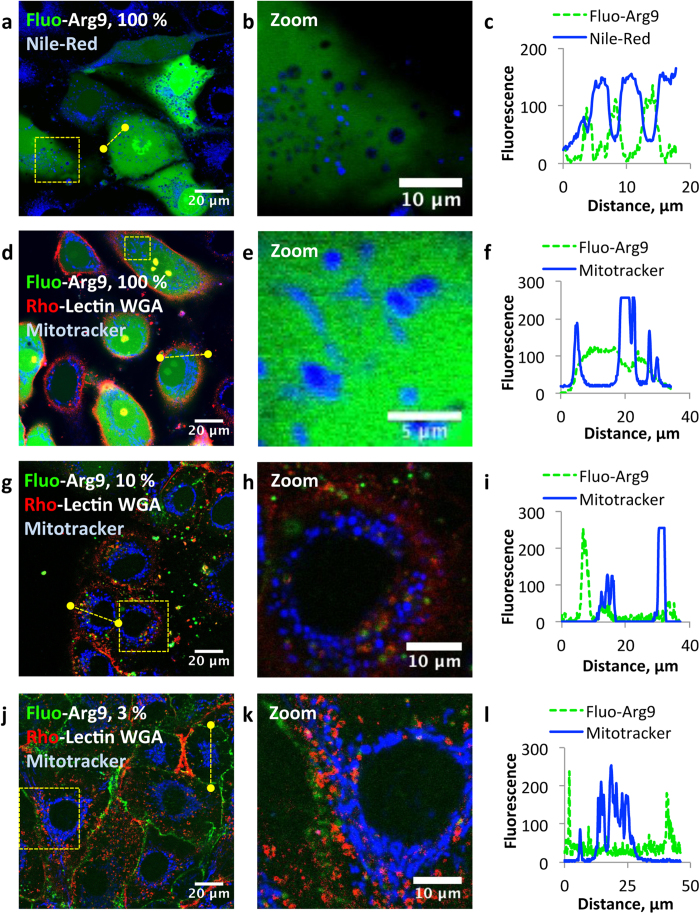
Figure 4. Lipid droplets and mitochondria colocalize with dark dots into the cytoplasm and correspond to Arg9-poor regions.
Unfixed MA-104 cells were visualized by CLSM after 10 min incubation with Fluo-Arg9 (in green) in Opti-MEM in the presence of specific staining fluorescent dyes. (a–c) Cells were incubated with 20 μM Fluo-Arg9. Lipid droplets were stained by Nile-Red (in blue). Due to spectral overlap with the CPP or with Nile-Red, cells were not co-incubated with a fluorescent Lectin WGA. (d–l) Cells were visualized by CLSM after 10 min incubation with 20 μM Arg9 in Opti-MEM in the presence of Rho-Lectin WGA (in red) and mitotracker deep-red (in blue). Arg9 was either 100% (d–f), 10% (g–i) or 3% (j–l) labeled with fluorescein. (a,d,g,j) are overlays between the fluorescence of the peptide, of the Lectin WGA (if applicable) and of the organelle staining agents. (b,e,h,k) are enlarged views of the yellow square drawn on the picture (a,d,g,j), respectively. (c,f,i,l) are intensity profiles of the green and blue fluorescence along the yellow dotted line of the picture (a,d,g,j), respectively.

