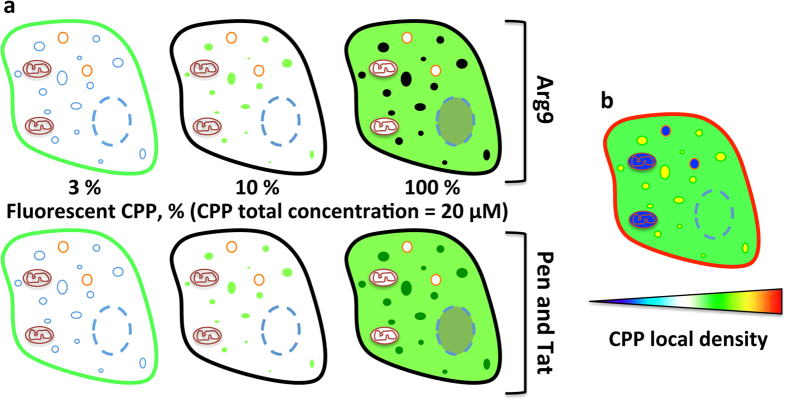
Figure 6. Mapping the subcellular distribution of CPPs.
(a) Subcellular distribution of the fluorescence of the CPP labeled with fluorescein (total concentration 20 μM, in green) depending on the dilution. At high dilution (3%), only the plasma membrane is fluorescently stained by the CPP. At intermediate dilution (10%), a punctuated fluorescence is systematically observed, whatever the considered CPP. With 100% fluorescent CPP, the cell cytosol exhibits a high fluorescence. But regarding the lysosomes, two patterns can be distinguished: they are either highly fluorescent (Pen and Tat) or the fluorescence of the concentrated CPP is self-quenched (Arg9). (b) Recapitulation of the subcellular distribution of CPP as deduced from the dilution experiments: CPP are mostly adsorbed on the plasma membrane (red), locate in lysosomes (yellow) and are also present in the cytosol (green). Lipid droplets and mitochondria do not contain Arg9 CPP (blue).

