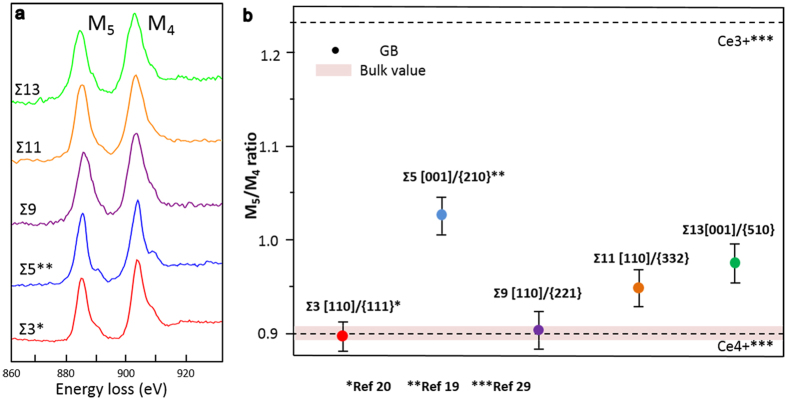
Figure 2. EEL spectra and their M5/M4 ratios for the model GBs.
(a) Ce M4,5 edge EEL spectra obtained from the area shown in Figure 1b, (b) the M5/M4 ratios calculated by the positive part of second derivative of the spectrums in Figure 2a. The pink area is the bulk value taken from the bulk region of all model GBs. * from Ref 20, ** from Ref 19 and *** from Ref 29.

