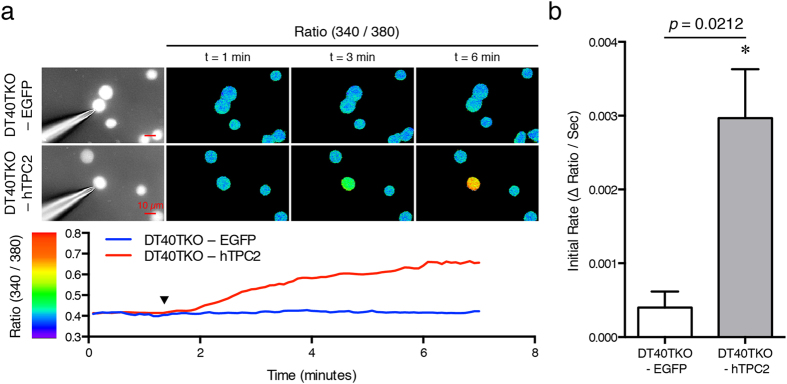
Figure 2. Calcium imaging of hTPC2 expressed in DT40TKO cells.
(a) Fura-2 ratiometric images showed changes in the cytosolic Ca2+ concentrations of cells dialysed with 10 nM NAADP in the whole-cell configuration at different time points (upper panel). Representative Fura-2 fluorescent ratio in response to pipette-dialysed NAADP in DT40TKO-EGFP or DT40TKO-hTPC2 cells. Arrowhead indicates the achievement of whole-cell configuration (lower panel). (b) Summary of the initial rate of the Fura-2 fluorescent ratio in cells dialysed with 10 nM NAADP. Bars are presented as mean ± SEM from 3 experiments and data are compared by Student’s t-test.

