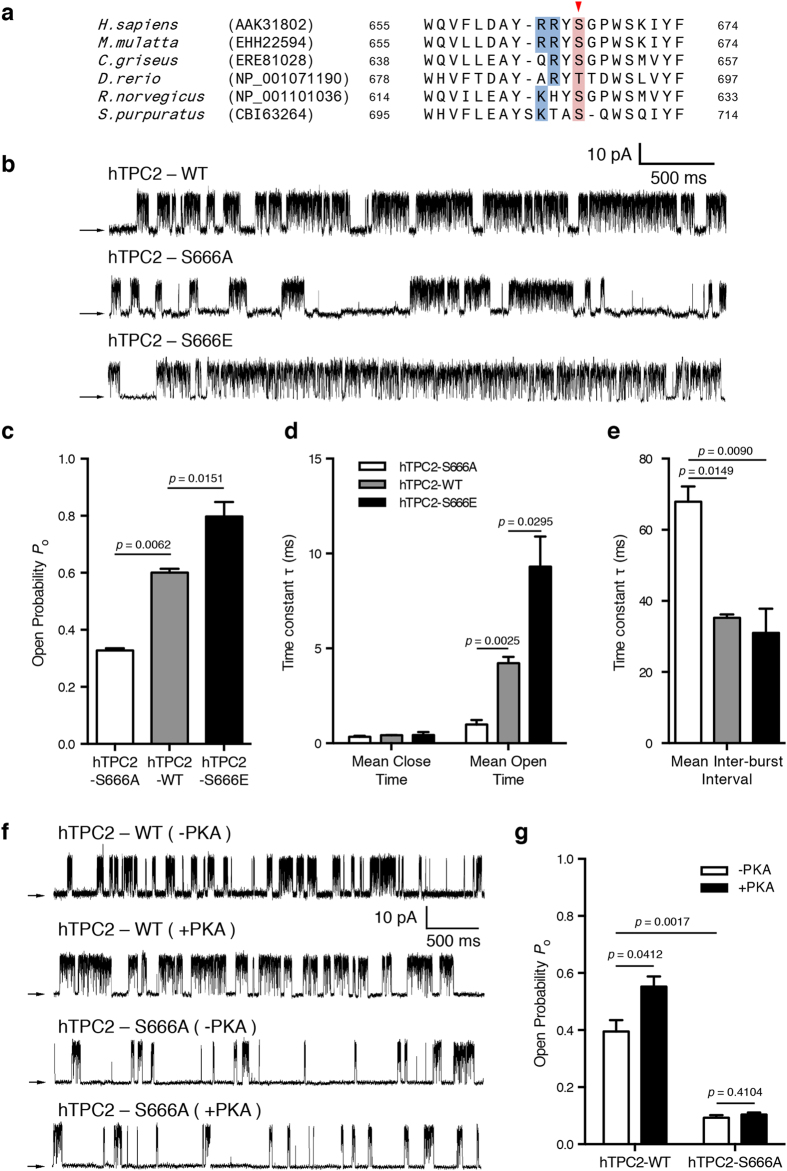
Figure 6. PKA phosphorylation increased hTPC2 channel Po.
(a) Sequence alignments of mammalian TPC2 C-terminus highlighted a conserved putative PKA phosphorylation site with a consensus sequence of RRXS/T. (b) Representative current traces recorded from isolated nuclei of wild-type hTPC2, S666A, and S666E DT40TKO cell lines activated by 100 nM NAADP. Arrows indicate zero current level and the data were recorded at +60 mV. (c) Summary of NAADP-elicited TPC2 Po detected in wild-type hTPC2, S666A, and S666E cell lines. (d) Summary of effects of PKA phosphorylation on hTPC2 channel mean open and closed times. Data were summarized as mean ± SEM from 3 individual experiments and were compared to wild-type hTPC2 (Dunnett’s post hoc test following a one-way ANOVA in (c,d). (e) Summary of effects of PKA phosphorylation on mean inter-burst interval of hTPC2 channel. Data were summarized as mean ± SEM from 3 individual experiments and were analysed by one-way ANOVA with Tukey’s post hoc test. Individual dwell time analysis was presented in Supplementary Fig. 5. (f) Representative current traces from isolated nuclei of wild-type hTPC2 and S666A stimulated by 10 nM NAADP together with or without PKA catalytic subunit (50 nM) in the pipette solution. (g) Summary of effects of PKA catalytic subunit on single-channel Po detected from wild-type hTPC2 and hTPC2-S666A nuclei. Data were summarized as mean ± SEM from 3 individual experiments and were analysed by one-way ANOVA with Tukey’s post hoc test.

