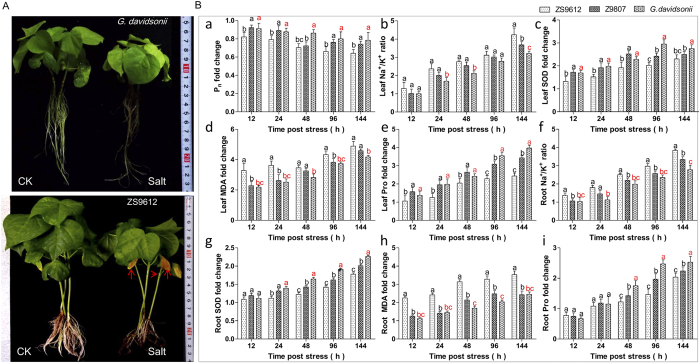
Figure 1. Physiological analysis of G. davidsonii and G. hirsutum in response to various durations of salt stress.
(A) Phenotype of G. davidsonii and G. hirsutum cv. ZS9612 at 144 h post salt stress (200 mM NaCl). (B) Various physiological index involved in salt stress on roots and leaves indicated. (a) Leaf photosynthetic rate (Pn) fold changes at different times post salt stress. (b–e) Leaf Na+/K+ ratio, SOD, MDA, and proline fold changes at different time post salt stress. (f–i) Root Na+/K+ ratio, SOD, MDA, and Proline fold changes at different times post salt stress. G. davidsonii seedlings grown under normal conditions were used as controls. At least three biological replicates were used. Multiple comparisons were performed with significant difference in different letter at P < 0.05 level; Error bars represent SD.

