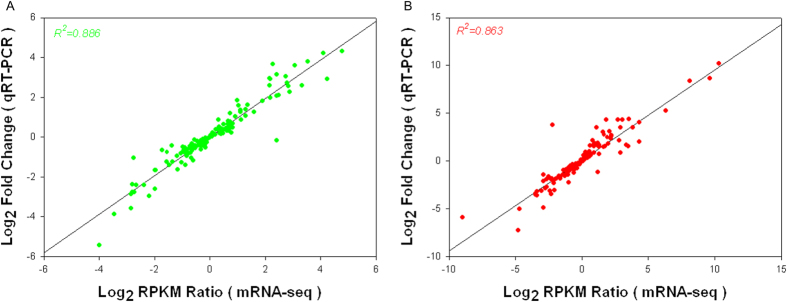
Figure 9. qRT-PCR validation of transcript levels evaluated by RNA-Seq in roots and leaves of G. davidsonii under 200 mM NaCl stress conditions.
(A,B) represent the correlation of the fold change analyzed by RNA-Seq platform (x-axis) with data obtained using real time PCR (y-axis) in roots and leaves of G. davidsonii. 30 independent genes were randomly selected: 10 up-regulated genes, 10 unchanged genes and 10 down-regulated genes. Three biological replicates were used from each sample at five time points post salt stress.

