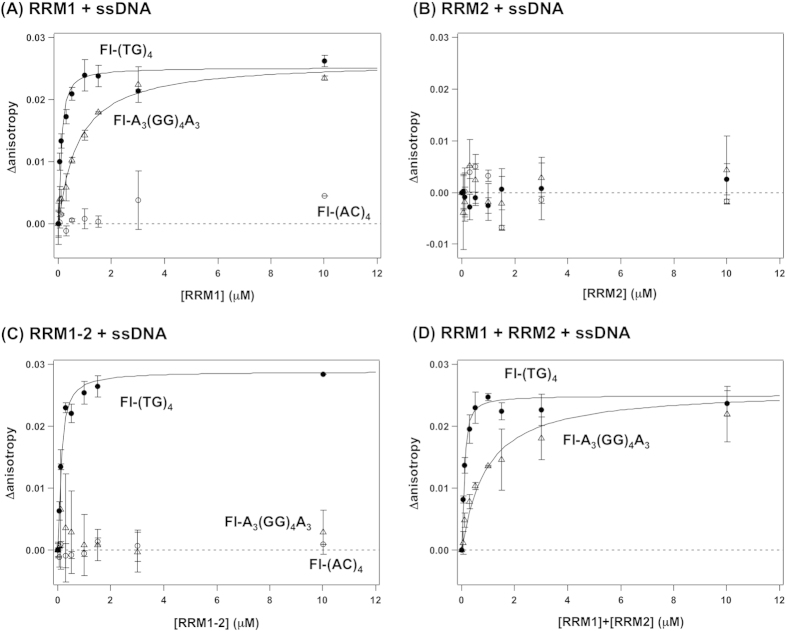
Figure 3. Analysis of the sequence-dependent interaction between RRM proteins and ssDNA by fluorescence anisotropy measurements.
0.1 μM Fl-(TG)4 (filled circles), Fl-(AC)4 (open circles), and Fl-A3(GG)4A3 (open triangles) were titrated with (A) RRM1, (B) RRM2 (C) RRM1–2 and (D) an equimolar mixture of RRM1 and RRM2, and the fluorescence anisotropy was measured. To estimate the dissociation constant, Kd, between RRM and ssDNA, anisotropy data were fitted to eqs 1 and 2 and fitted functions were shown as solid curves. More than three independent experiments were performed to estimate error bars (standard deviations).

