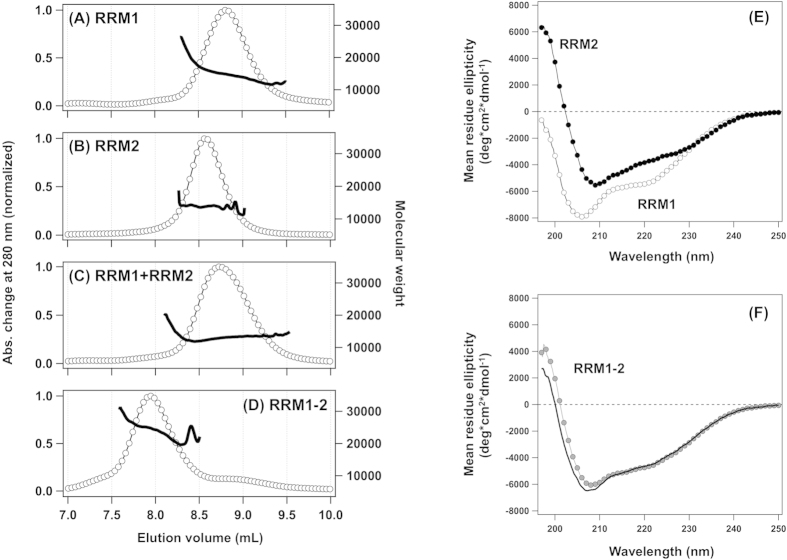
Figure 4. Limited interactions between RRM1 and RRM2 in their free forms.
(A) 1 g/L (90 μM) RRM1, (B) 1 g/L (~100 μM) RRM2, (C) a mixture of 1 g/L RRM1 and 1 g/L RRM2, and (D) 1 g/L (~50 μM) RRM1–2 were analyzed by SEC-MALS. Chromatograms obtained by monitoring changes in absorbance at 280 nm are shown (open circles, left axis). Molecular weight of a species eluted from a gel filtration column was also analyzed with an on-line MALS and is shown in the chromatograms (a thick curve, right axis). (E,F) Secondary structures of RRM proteins were analyzed by CD spectroscopy: 20 μM RRM1 (open circles) and 20 μM RRM2 (filled circles) in (E), and 20 μM RRM1–2 (filled gray circles) in (F). A calculated CD spectrum of RRM1–2 was obtained by the sum of the CD spectra between RRM1 and RRM2 and is shown as a solid curve in (F).

