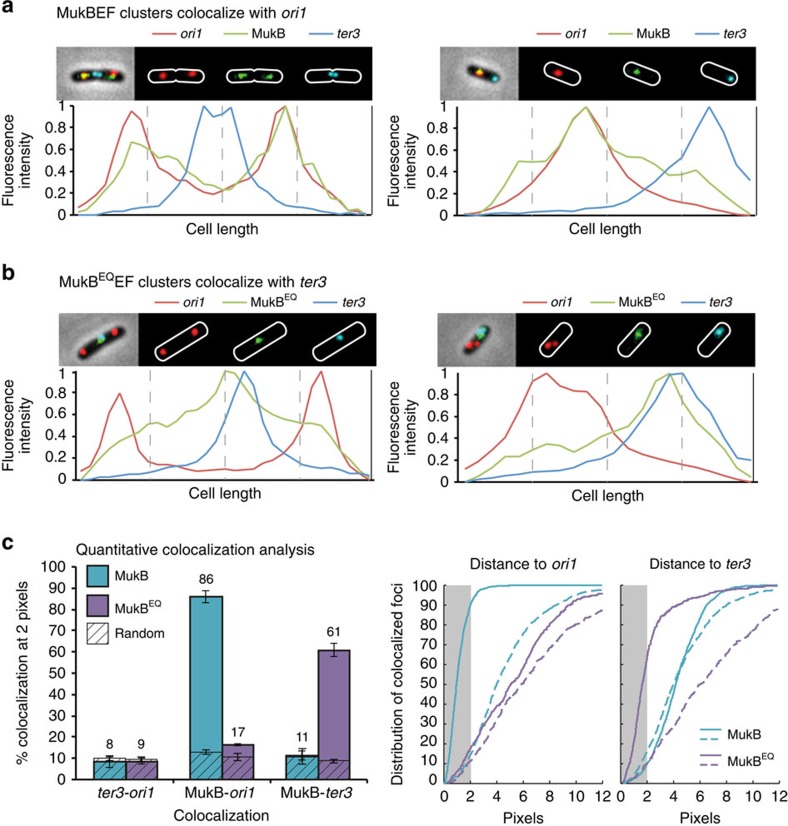
Figure 1. ATP hydrolysis-impaired MukBEQEF complexes associate with ter.
Localization of ori1, ter3, and MukB-mYPet (SN182) (a) or MukBEQ-mYPet (SN311) (b). The ori1 locus is a lacO array bound by LacI-mCherry, and the ter3 locus is a tetO array bound by TetR–CFP. The normalized fluorescence intensity along the cell length is shown below each image. (c) Left panel: % colocalization at 2 pixels between MukB, MukBEQ, ori1 and ter3 focus centroids in the combinations shown. Dashed boxes represent the distances measured to a random pixel position in the cells analysed. The histograms show the mean (±s.d.) of three independent experiments. Middle and right panels show cumulative distributions of the distances between MukB, or MukBEQ, and ori1 or ter3 foci, respectively, obtained in one experiment. Dashed lines represent distances measured to a random pixel. The grey rectangle indicates the distances within 2 pixels (258 nm). See also Supplementary Figs 1 and 2. CFP, cyan fluorescent protein).

