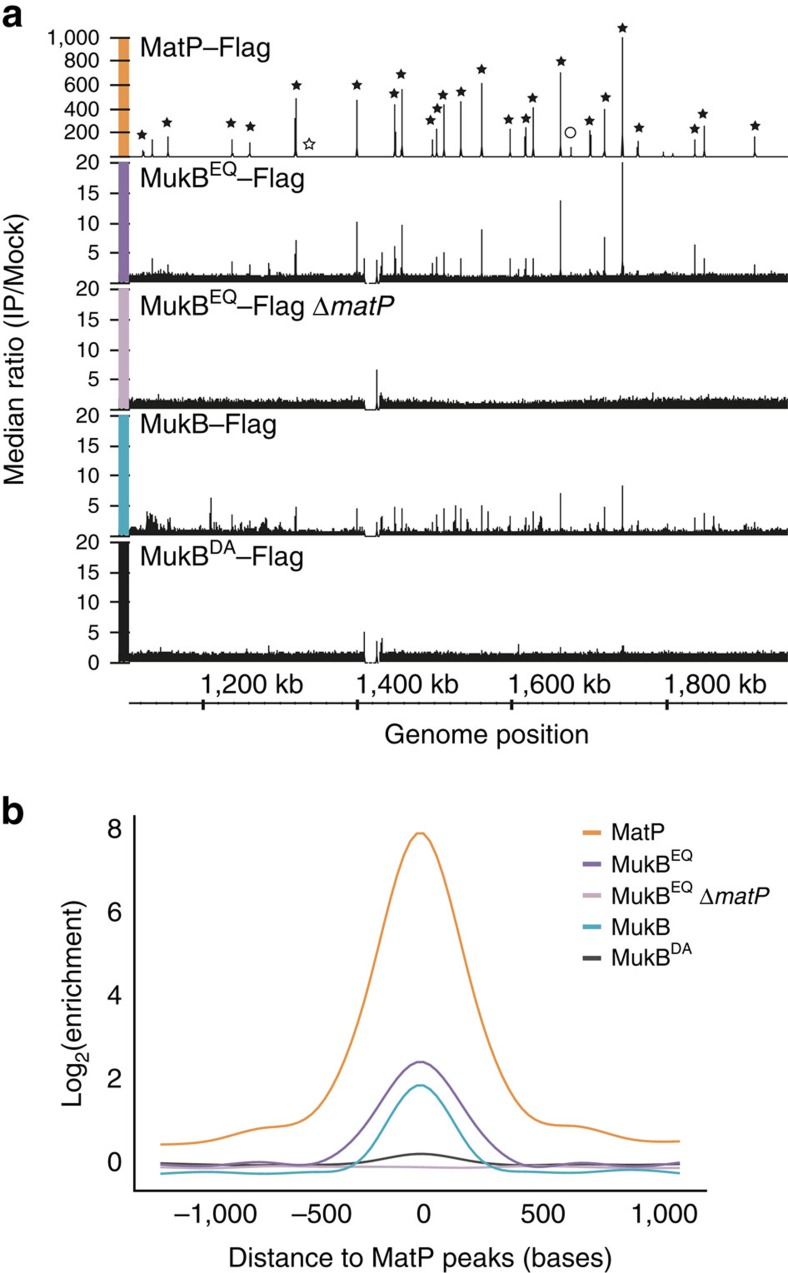
Figure 3. MukBEQ–Flag protein enrichment at matS sites is dependent on MatP.
(a) Distribution of ChIP-seq signals in ter for MatP–Flag, MukBEQ–Flag, MukBEQ–Flag ΔmatP, MukB–Flag and MukBDA–Flag. Each graph represents the ratio of the median number of reads of three experiments between Flag-tagged strains (IP) and untagged strains (Mock). Black stars indicate the positions of matS and pseudo matS sites and the circle indicates a non-mats-enriched region included in the analysis in b. matS5, which showed no enrichment, was not included into the analysis in b, and is indicated by a white star. The figure was generated using Integrated Genome Browser56. (b) Median signals of normalized samples (see experimental procedures), smoothed in a window of 2 kb centred to the position of the 26 most significant MatP peaks (indicated in a) are shown. The graph shows ∼1.5-fold change between MukB and MukBEQ. Flat signals obtained for MukBEQ–Flag ΔmatP and MukBDA–Flag are indicative of an absence of significant enrichment. See also Supplementary Figs 4 and 5.

