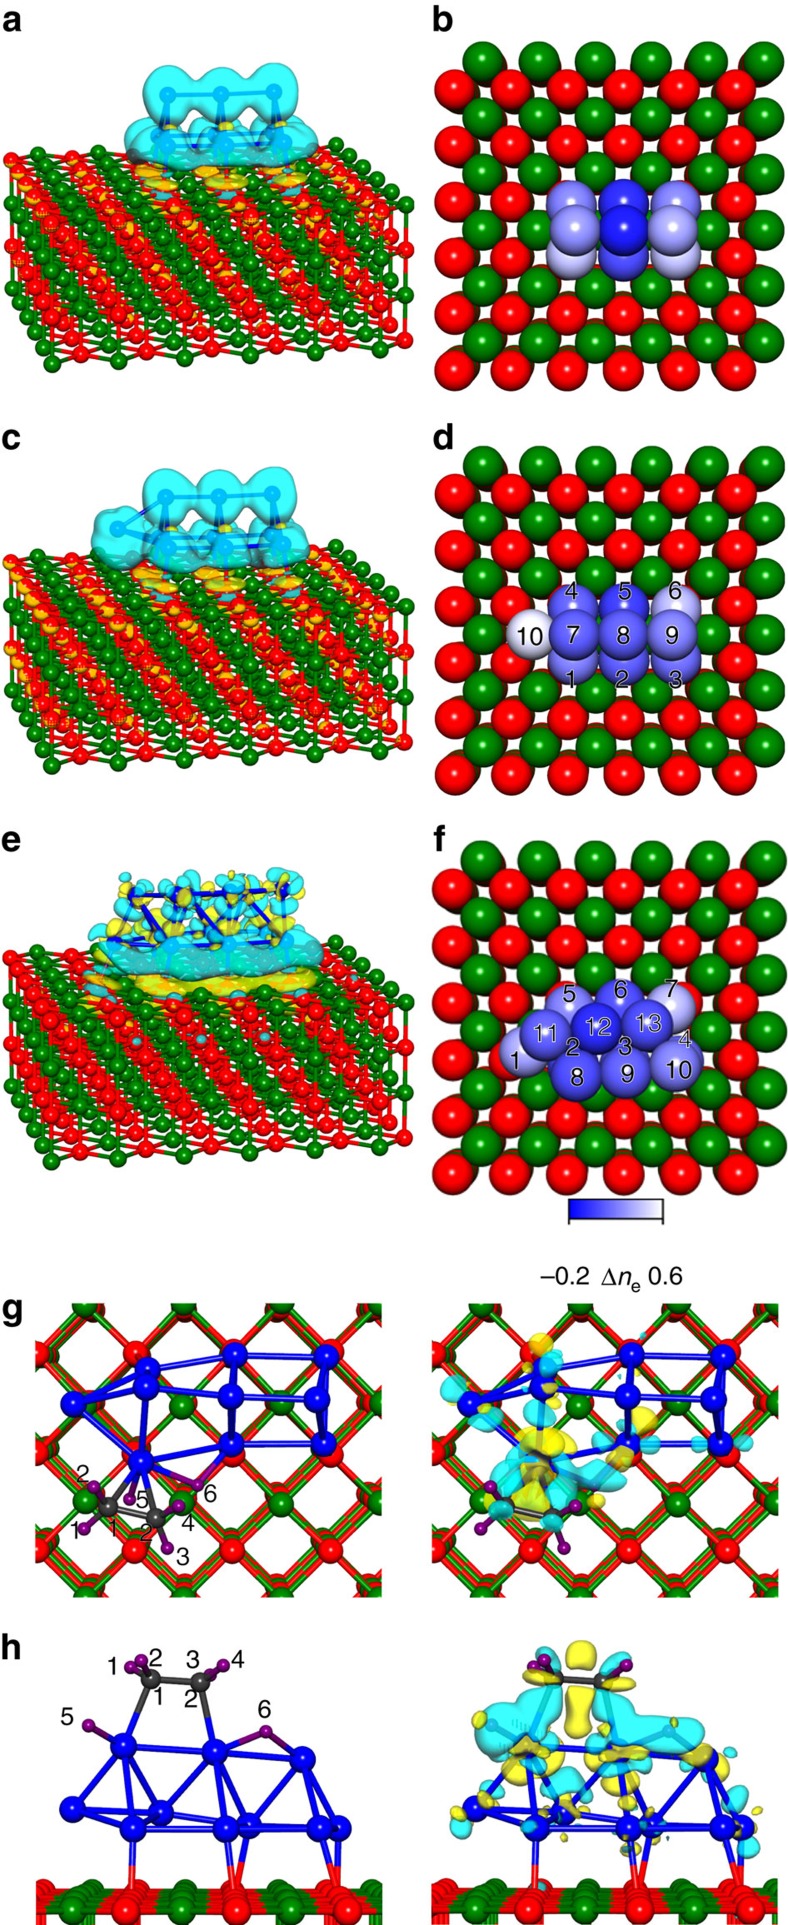
Figure 2. Optimal configurations and charge distribution of bare Ptn/MgO and co-adsorbed C2H4+H2.
a, c and e, corresponding to Pt9, Pt10 and Pt13 clusters, the blue and yellow contour hyper-surfaces correspond to excess (light blue) and deficient (yellow) charge distributions obtained as the difference between the total charges before and after adsorption of the clusters; these hypersurfaces are drawn such that the excess electronic (negative) charge inside the light blue hypersurface is 50% of the total electronic charge and the same for the positive charge inside the yellow hypersurfaces. Bader charge analysis is given in b,d and f, with lighter colour corresponding to excess number of electrons (that is, excess negative charge on the corresponding atom); for the values of the Bader charges, see Supplementary Figs 14 and 15. Co-adsorption of C2H4 and H2 on Pt10/MgO is shown for the π (g) and di-σ (h) bonding modes. The adsorption geometries are shown on the left, and on the right, we depict the bonding frontier orbitals of the adsorption system (the light blue and yellow denote different signs of the wave function); the σ-type Pt-C bonds are clearly seen in h (note the directed wave function contours on the right). In both g and h, atoms 5 and 6 are the proximal dissociated co-adsorbed H atoms.

