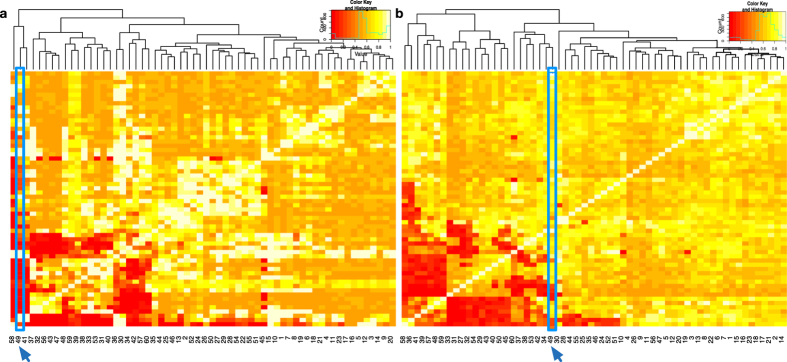
Figure 3. Normal samples provide an overall better prediction accuracy for patient survival and can be especially helpful for those patients with outlying survival prediction performances using tumor sample data alone.
(a) Heatmap of the consistency matrix from tumor samples in the 60-patient breast cancer data using Elastic Net Cox Regression. Red color represents low consistency, while yellow represents high consistency. Individual 49 is highlighted with blue arrow as being an outlier with generally poor consistency of prediction with real survival using tumor data. (b) Consistency matrix calculated from correspondent normal data. Individual 49 is highlighted also, and is generally with comparable consistency levels with others individuals and no longer outlying.

