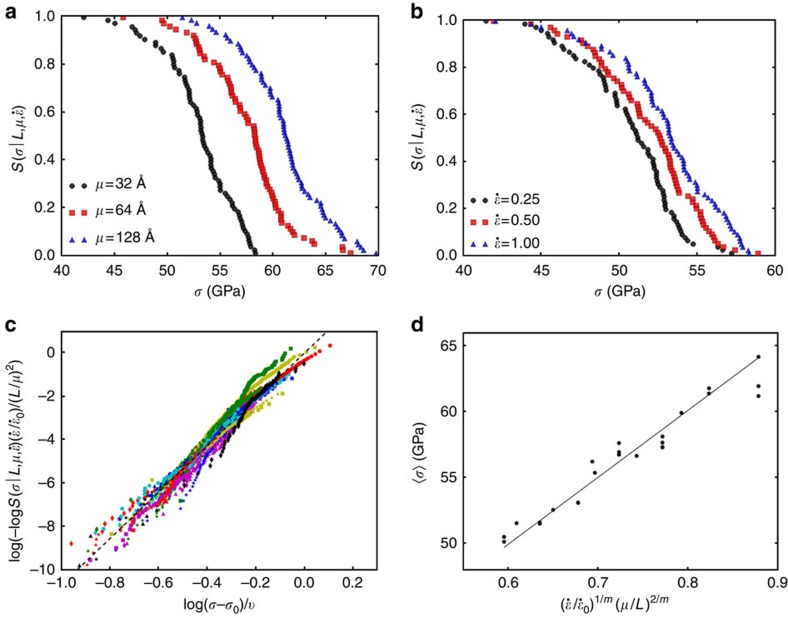
Figure 3. Statistical distribution of strengths in polycrystalline graphene.
(a) The variation of the survival probability in nanocrystalline graphene with grain size μ at  . At fixed stress, the smaller grain size has lower survival probability due to a higher density of GB and TJ defects. (b) The variation of survival probability with strain rate
  (in units of
  ) at
) at  . (c) A data collapse of the survival probability (obtained from MD simulations) according to equation (1) for 24 different combinations of
  (see Methods section). The dashed black line is a guide to the eye and shows the prediction of equation (1). The simulation data closely follows the predicted form. (d) A collapse of the mean failure stress as predicted by equation (2). Note that this collapse has no free parameters.

