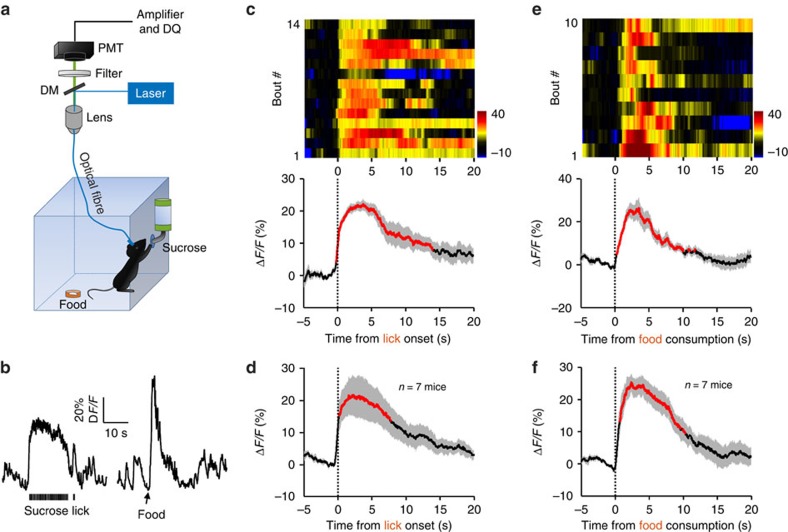
Figure 1. Sucrose lick and food intake increase Ca2+ signals of DRN 5-HT neurons.
(a) Schematic of the fibre photometry setup. Ca2+ transients were recorded from GCaMP6-expressing DRN 5-HT neurons of SERT-Cre mice that had free access to sucrose solution and food pellets in a test chamber. DM, dichroic mirror; PMT, photomultiplier tube. (b) Raw traces of GCaMP6 fluorescence changes that were associated with sucrose lick and food intake. ΔF/F represents change in fluorescence from the mean level before the task. (c) Ca2+ signals associated with bouts of sucrose lick in a behavioural session. Upper panel, the heatmap illustration of Ca2+ signals aligned to the initiation of sucrose licking bouts. Each row plots one bout and a total of 14 bouts are illustrated. Colour scale at the right indicates ΔF/F. Lower panel, the peri-event plot of the average Ca2+ transients and lick frequency. Thick lines indicate mean and shaded areas indicate s.e.m. Red segments indicate statistically significant increase from the baseline (P<0.05; permutation test). (d) Mean Ca2+ transients associated with sucrose lick for the entire test group (n=7 mice). (e,f) Ca2+ transients elicited by food intake (n=7 mice). Data from ten bouts are plotted in e. Same conventions as in c and d.

