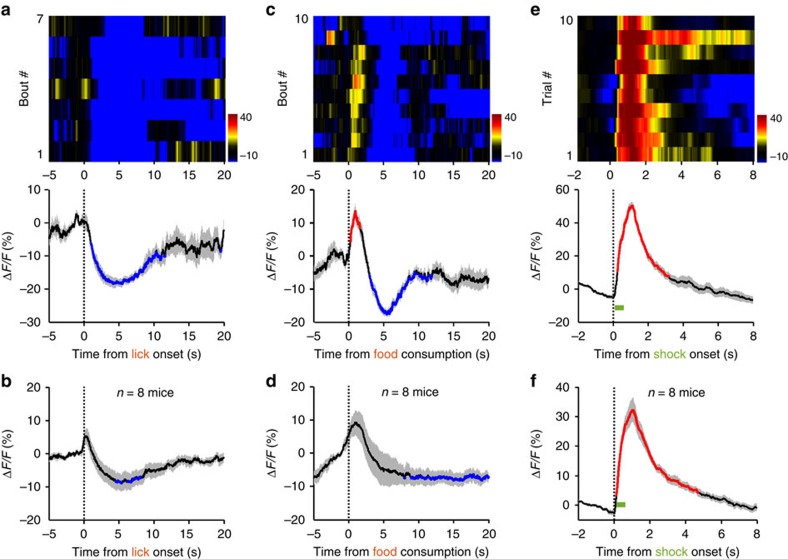
Figure 7. The effects of appetitive and aversive stimuli on the Ca2+ signals of DRN GABA neurons.
Results from a VGAT-DRNGCaMP6m mouse (a) and the population data (b; n=8 mice) showing Ca2+ signals associated with sucrose lick. Each row in the upper panel of a represents one licking bout in a behaviour session. Thick lines indicate mean and shaded areas indicate s.e.m. Red and blue line segments in the plots represent significant increase and decrease of Ca2+ signals (P<0.05; permutation tests), respectively. The effect of food intake on the Ca2+ signals of DRN GABA neurons from a single mouse (c) and the entire test population (d; n=8 mice). The effect of random footshocks on Ca2+ signals in DRN GABA neurons from a single mouse (e) and the entire test population (f; n=8 mice).

