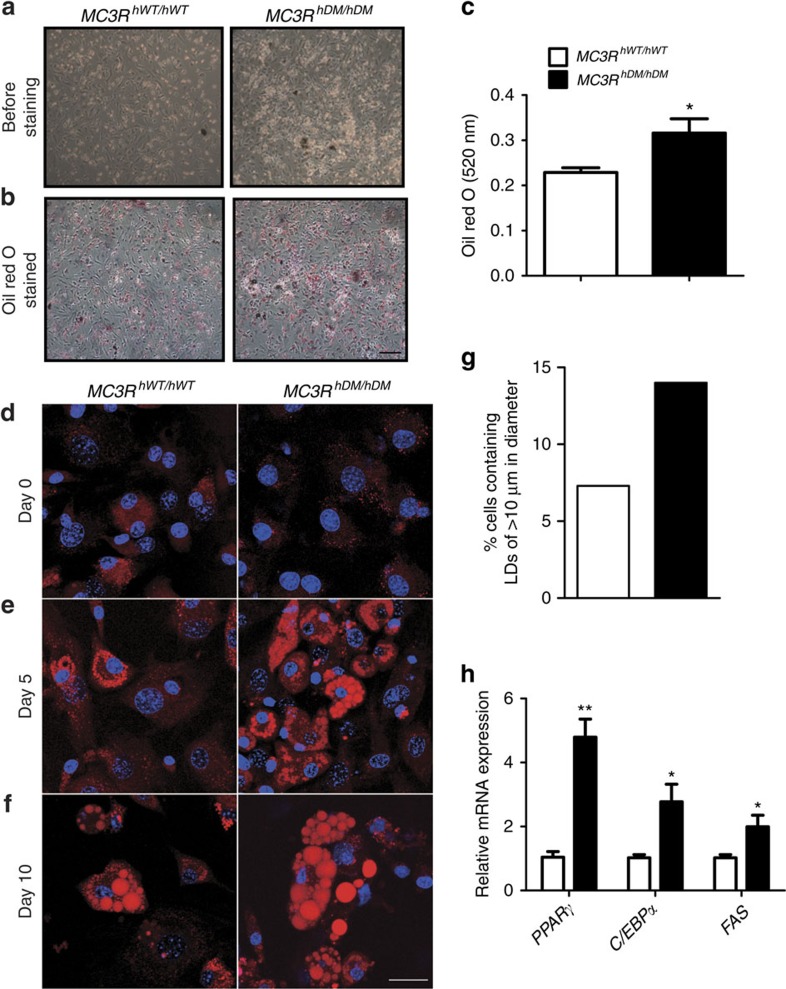
Figure 10. Increased adipocyte differentiation in MSCs of MC3RhDM/hDM mice.
MSCs were isolated as described in Fig. 8. (a–f) MSCs were differentiated into adipocytes to examine differentiation capacity. Cells were isolated from one mouse for each group, and six independent experiments were performed (n=6 per group). (a) Microscopic images (× 10) of MSCs differentiated into adipocytes for 18 days. (b) Microscopic images of differentiated adipocytes after Oil red O staining. Scale bar, 100 μm (c) Oil red O was extracted and quantified at 520 nm. (d–f) Confocal microscopic images of MSCs differentiated into adipocytes. Cells were stained with Nile Red and Hoechst 33342 at indicated days. Representative maximum intensity projection images of lipid droplets (LDs, red) and nuclei (blue) are shown. Scale bar, 25 μm (g) The percentage of cells displaying LDs>10 μm in diameter was quantified (n=∼350). (h) qPCR analysis of genes related to adipocyte differentiation (7 days after differentiation). Similar results were found for male mice (data not shown). Data are represented as mean±s.e.m. for c and h. Groups were compared by Student's t-tests (two-tailed) (c,h).

