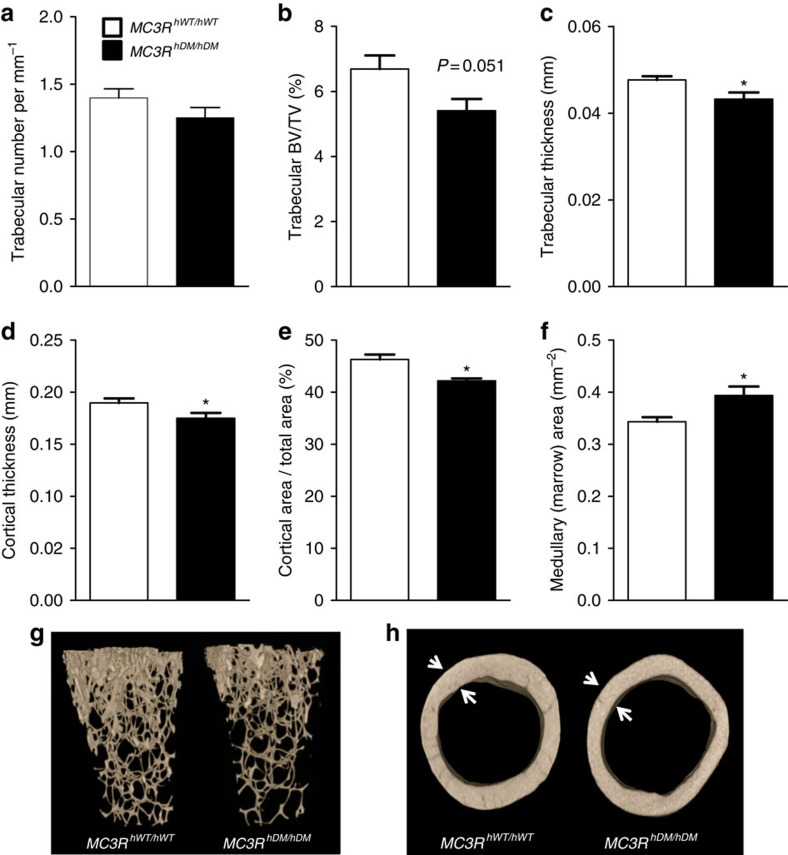
Figure 3. Micro-CT shows decreased bone in femurs of MC3RhDM/hDM mice.
(a) Trabecular number (per mm) of chow-fed female (12-week old) MC3RhDM/hDM and MC3RhWT/hWT mice. (b) Trabecular bone-volume fraction: Trabecular Bone Volume/Total Volume (BV/TV), (c) Trabecular thickness, (d) average cortical thickness, and (e) Cortical area per Total area fraction were reduced in MC3RhDM/hDM; (f) Medullary (marrow) area was increased in MC3RhDM/hDM; (g) representative reconstructed 3D images of femur trabecular bones; (h) representative cross-sectional cortical bones (h). Data are represented as mean±s.e.m.; MC3RhWT/hWT n=7; MC3RhDM/hDM n=8. *P<0.05 MC3RhDM/hDM versus MC3RhWT/hWT mice. Groups were compared by Student's t-tests (two-tailed) (a–f).

