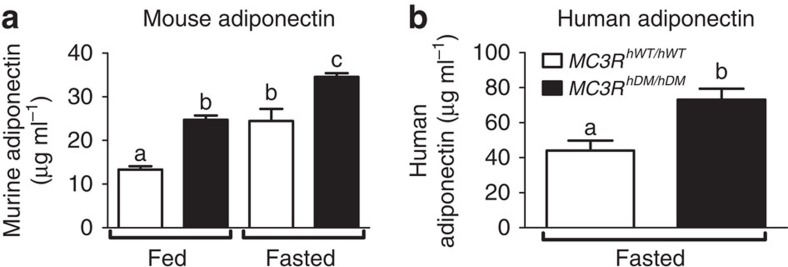
Figure 7. Increased serum adiponectin in MC3RhDM/hDM mice and humans.
(a) Serum adiponectin levels were measured in 3-month-old female MC3RhWT/hWT (open bars) and MC3RhDM/hDM (closed bars) mice under fed (n=8 per group) and fasted (n=11 per group). (b) Plasma samples from a matched cohort of MC3RhWT/hWT and MC3RhDM/hDM children (Supplementary Table 4) were analysed for adiponectin (n=13 per group). Data are represented as mean±s.e.m. A different letter represents significant differences at P<0.05 compared with the other groups. Groups were compared by one-way analysis of variance followed by Bonferroni post-tests (a) and analysis of covariance (b).

