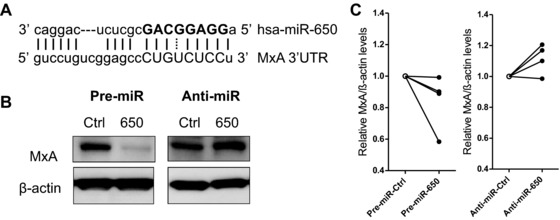
Figure 4.

miR‐650 fine‐tunes the expression of the antiviral ISG MxA. (A) Schematic representation of the miR‐650:MxA duplex as predicted by MicroCosm with the miRNA seed highlighted in bold. (B) Effect of miR‐650 on MxA expression levels in MDDCs. MDDCs were transfected with miR‐650 pre‐miR, anti‐miR, or corresponding scramble controls for 24 or 48 h and MxA expression was measured by immunoblot. One representative donor of four is shown. (C) Quantification of immunoblot analysis described above. MxA levels were normalized against β‐actin protein expression and are shown relative to respective scramble control. Data from four individual donors are shown. Statistical significance was tested using a paired Student's t‐test and changes in MxA expression were considered to be not significant.
