
Figure 1.
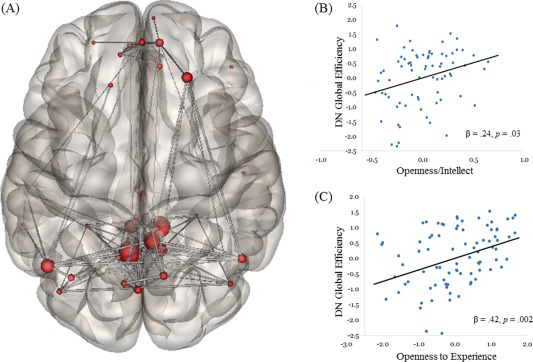
Graph analysis of DN efficiency and its relation to Openness to Experience. A: Group‐level depiction of nodes and edges used to define the DN. B: Scatterplot showing the relation between latent Openness/Intellect and DN global efficiency, controlling for age and gender. C: Scatterplot showing the relation between latent Openness to Experience and DN global efficiency, controlling for age, gender, intelligence, and other personality factors. Note: All variables were standardized by Z‐transformation. [Color figure can be viewed in the online issue, which is available at http://wileyonlinelibrary.com.]