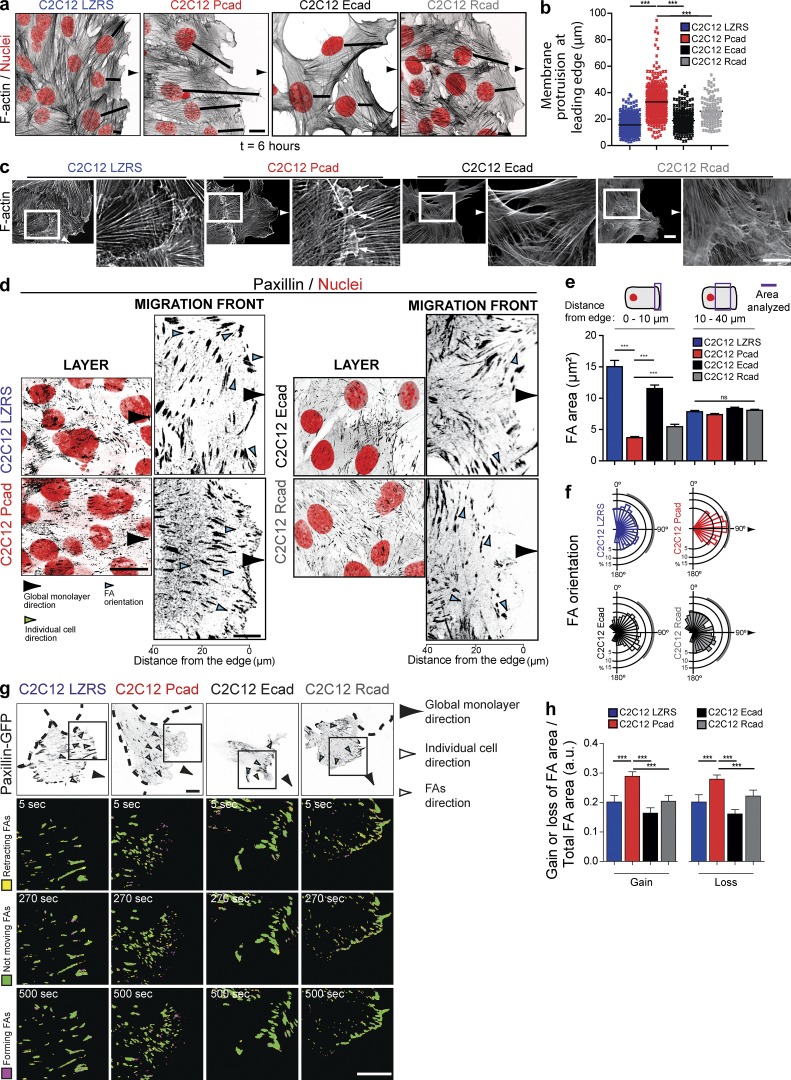
Figure 2.
Specific cellular and FA organization after P-cadherin expression. (a and b) F-actin (black, inverted contrast image) and nuclei (red) visualization indicating the formation of a large protrusion in P-cadherin–expressing cells as illustrated in the box plots. 384 (C2C12 LZRS), 373 (C2C12 Pcad), 115 (C2C12 Ecad), and 263 (C2C12Rcad) cells from four independent experiments were analyzed. Bar, 10 µm. ***, P < 0.0005. (c) F-actin staining of the four cell lines revealed cryptic lamellipodia in C2C12 Pcad cells (arrows). The right panels show higher-magnification images of the outlined region (white rectangle). Bars, 10 µm. (d) Confocal images of migrating cells stained for paxillin (inverted contrast images) and nuclei (red) are shown. Left panels, inside the layer; right panels, at the migration front. Bar, 10 µm. (e) Quantification of the FA area measured 0–10 µm or 10–40 µm from the leading edge. The presented value is the ratio of the area to the total surface. Data represent the means ± SEM of five independent experiments. More than 400 FAs were analyzed from 30 cells. ***, P < 0.0005. (f) Rose plot showing the distribution of the orientation angles of the FAs calculated using the monolayer migration direction as the reference axis (90°). The area of each bin represents the number of FAs in that direction. More than 2000 FAs were analyzed from three independent experiments. (g) Paxillin-GFP dynamics in cells at the first multicellular row were monitored at 8 h after removal of the insert at 5-s intervals for 15 min; inverted contrast images are shown. Dashed lines indicate the nontransfected surrounding cells. The insets indicate a cell area shown at three time points. Inverted contrast images of paxillin-GFP are in gray. Ratio images were generated to illustrate FA dynamics. Bars, 15 µm. (h) FA area was quantified over a period of 15 min, and mean values normalized to the area of the FA as well as the change in mean intensity are given. The means ± SEM of five independent cells are shown. a.u., arbitrary units.

