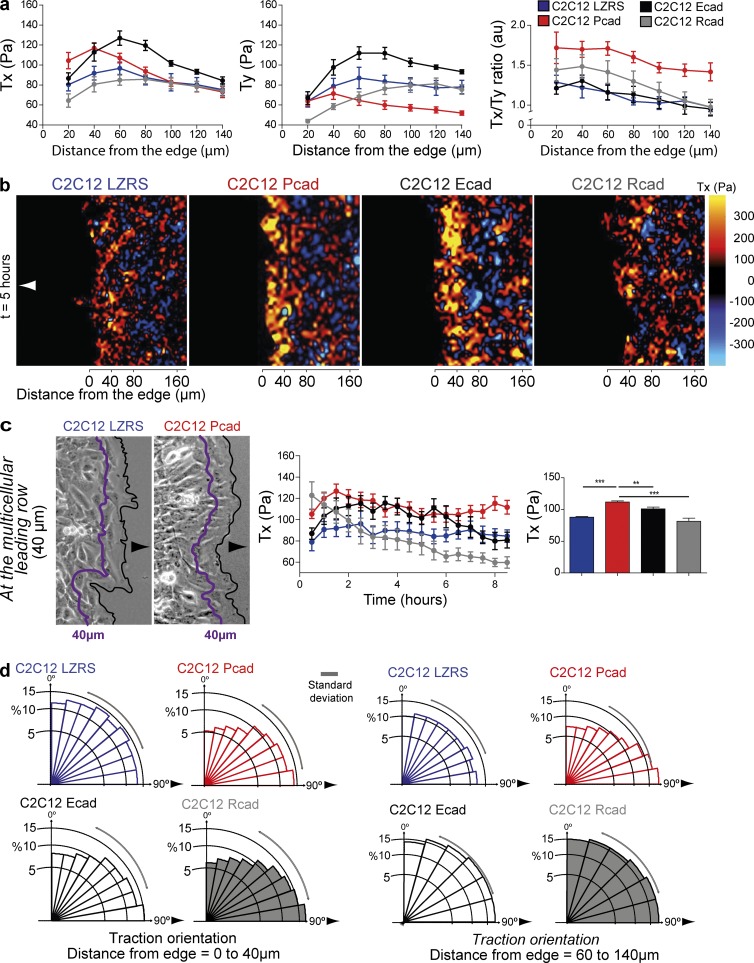
Figure 3.
P-cadherin expression reorganizes and increases traction forces. (a) Traction forces in the x direction (Tx), i.e., parallel to the axis of migration, or in the y direction (Ty), i.e., perpendicular to the axis of migration, measured every 20 µm from the multicellular leading row toward the center of the layer 4–10 h after removal of the PDMS membrane. The Tx/Ty ratio is calculated in the same conditions. Histograms represent the mean ± SEM calculated from n = 6 for each cell line from three independent experiments. au, arbitrary units. (b) Representative image of the traction (Tx) force maps at 6 h after removal of the PDMS membrane. Color bar indicates relative values. Arrowheads indicate the direction of migration. (c) Tx measured from 0 to 40 µm (as indicated in the phase-contrast images; arrowheads indicate the direction of migration) at 0–8 h. Histogram representing the mean ± SEM of Tx over 8 h. n = 6. (d) Overall orientation of traction forces. n = 6 from three independent experiments. All panels: values are means ± SEM. **, P < 0.005; ***, P < 0.0005; ns, nonsignificant.

