Figure 4.
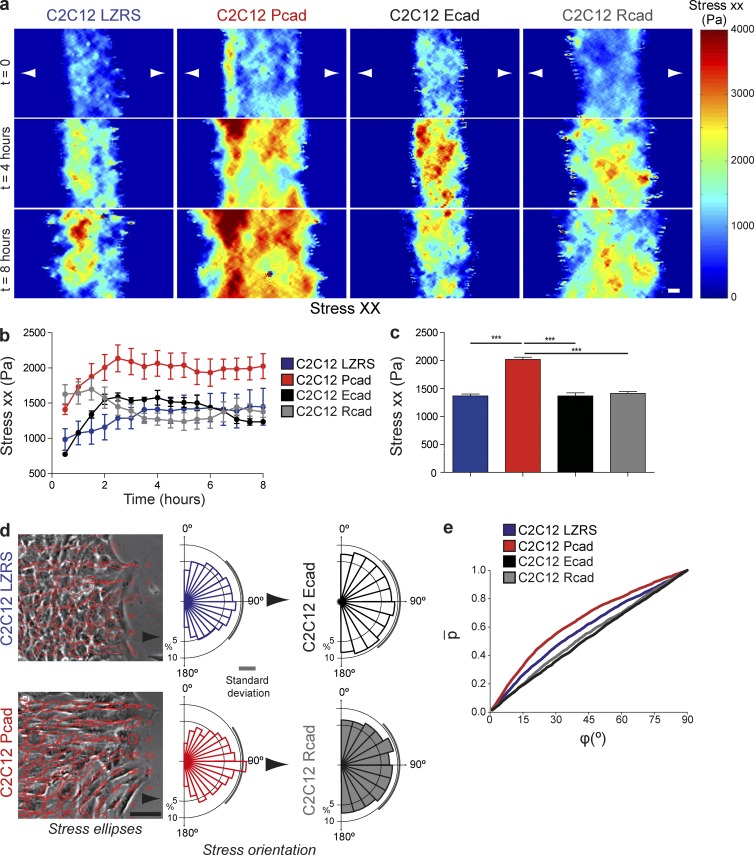
P-cadherin expression increases intercellular stress. (a) Intercellular stress maps parallel to the migration direction (stress xx) measured at the indicated time after removal of the PDMS membrane. n = 6 areas analyzed for each cell line from three independent experiments. (b) Stress xx over 8 h after removal of the insert. (c) Histograms of the maximum principal stress measured over 8 h. n = 6. (d) Principal stress ellipses at 8 h after removal of the PDMS membrane and rose plots of the angle between the principal stress direction and velocity. Arrows indicate the direction of migration. n = 6. (e) Cumulative probability distribution of the angle between cellular velocity and the maximum principal stress for the highest quintile of stress anisotropy (measured using the maximum shear stress). All panels: values are the means ± SEM. ***, P < 0.0005. Bars: (a) 40 µm; (d) 100 µm.

