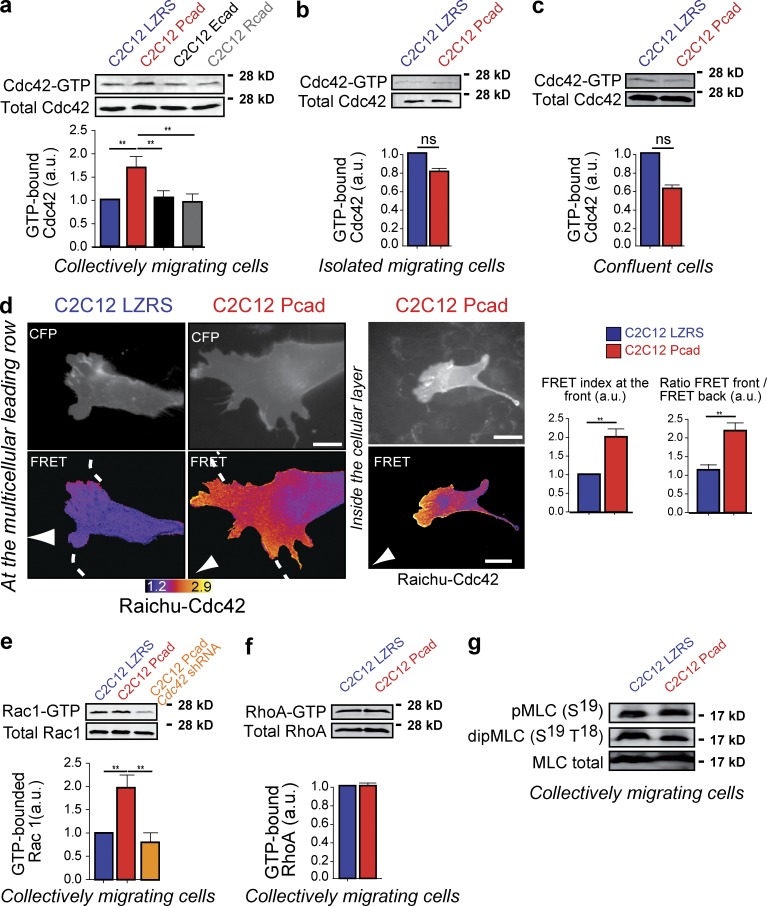
Figure 5.
P-cadherin–dependent Cdc42 activation during CCM. (a–c) The level of GTP-bound Cdc42 was measured using GST fused to the CRIB domain of PAK (GST-CRIB) in lysates obtained from cells 5–6 h after wounding (a), in migrating isolated cells (b), and in confluent (c) C2C12 LZRS and C2C12 Pcad cells. Cdc42 was detected by immunoblotting. Histograms represent the GTP-bound Cdc42 normalized to the amount of total protein. The mean ± SEM of five independent experiments is shown. (d) Cdc42 activity was mapped using the FRET reporter Raichu-Cdc42. Examples of increased Cdc42 activity after P-cadherin expression at the leading edge of the migrating cells and at cell–cell contacts inside the cellular layer are shown. Histograms represent the quantification of the FRET index at the front of C2C12 LZRS and C2C12 Pcad migrating cells (top) and the ratio of the FRET index between the front and back in these cells (bottom). n = 42 for C2C12 LZRS and 56 for C2C12 Pcad cells. The mean ± SEM of four independent experiments is shown. (e and f) Levels of GTP-bound Rac1 (e) or RhoA (f) were measured using GST fused to the CRIB domain of PAK (GST-CRIB) or to the RhoA binding domain of Rhotekin, respectively, in lysates obtained from cells 5–6 h after wounding. GTPase was detected by immunoblotting, and histograms represent the GTP-bound GTPase normalized to the amount of total protein. The mean ± SEM of five independent experiments is shown. (g) The level of MLC phosphorylation was analyzed using antibodies that recognize mono- and di-phospho-MLC in cell lysates of C2C12 LZRS and C2C12 Pcad cells 6 h after wounding. Shown are representative Western blot images from three independent experiments. a.u., arbitrary units. **, P < 0.005.

