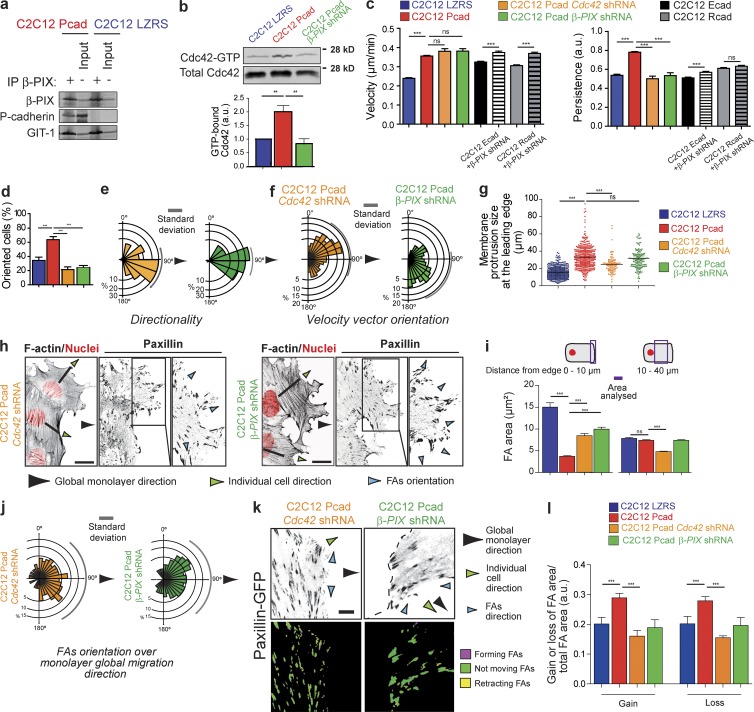
Figure 6.
Cdc42 and β-PIX are required for P-cadherin–induced CCM. (a) Lysates of C2C12 LZRS or C2C12 Pcad cells were immunoprecipitated using an anti–β-PIX antibody and immunoblotted for β-PIX, P-cadherin, and GIT-1, a known β-PIX partner. (b) The level of GTP-bound Cdc42 was measured using GST fused to the CRIB domain of PAK (GST-CRIB) in lysates obtained from cells 5–6 h after wounding in C2C12 LZRS, C2C12 Pcad, and C2C12 Pcad cells in which β-PIX was knocked down. Cdc42 was detected by immunoblotting. Histograms represent the GTP-bound Cdc42 normalized to the amount of total protein. The mean ± SEM of five independent experiments is shown. (c) Velocity and persistence of migration measured 4–15 h after removal of the insert in the indicated cells. n = 45 C2C12 Pcad Cdc42 shRNA cells, 50 C2C12 Pcad β-PIX shRNA cells, 230 C2C12 Ecad, 171 C2C12 Rcad, 97 C2C12 Ecad β-PIX shRNA, and 70 C2C12 Rcad β-PIX shRNA cells. The mean ± SEM of five independent experiments is shown. (d) Histogram quantifying cell polarity shown in Fig. S5 h. n = 120 C2C12 Pcad Cdc42 shRNA cells, 90 C2C12 Pcad β-PIX shRNA cells. (e) Rose plots of angle trajectories (i.e., directionality) shown in Fig. S5 i. (f) Orientation of the velocity vector (in Fig. S5 j) measured using MatPIV software in the entire cell layer at 10 h after insert removal. n = 1006 C2C12 Pcad Cdc42 shRNA; 998 C2C12 Pcad β-PIX shRNA cells. Arrowheads indicate the monolayer global migration direction. Compare with Fig. 1 h. (g) Box plots showing the size of membrane protrusions in the indicated cells. Shown is the mean ± SEM: ***, P < 0.0005; ns: nonsignificant. (h) C2C12 Pcad Cdc42 shRNA or β-PIX shRNA cells 8 h after removal of the insert were stained for nuclei (red), F-actin, and paxillin (inverted contrast images). Bar, 15 µm. (i) Quantification of the FA area measured 0–10 µm or 10–40 µm from the leading edge. More than 700 FAs were analyzed from 50 cells. Data represent the mean ± SEM of five independent experiments. (j) Rose plot showing the distribution of angles of FA orientation calculated using the monolayer migration direction as the reference axis; 90° corresponds to the reference axis. More than 700 FAs were analyzed from 50 cells. Data represent the mean ± SEM of five independent experiments. (k) Cells were transfected with paxillin-GFP, and FA dynamics were analyzed as described in Fig. 2 g. An inverted contrast image of paxillin-GFP is in gray. Ratio images (lower panels) were generated to illustrate FA dynamics, with magenta showing the extension and yellow the FA loss. Green represents the FA area maintained during the analyzed period. Bar, 10 µm. (l) FA area gains and losses were quantified over 15 min. The mean values normalized to the area of the FA as well as the change in mean intensity is given. For all panels, the mean ± SEM is shown: ***, P < 0.0005. a.u., arbitrary units.

